Prices strengthened while transaction activity remained weak
Bulgaria's House Price Index accelerated in the second quarter, but the number and aggregate value of transactions remained below a year earlier. The divergence is useful evidence of a narrower market, not proof that every property or location is moving in the same way.
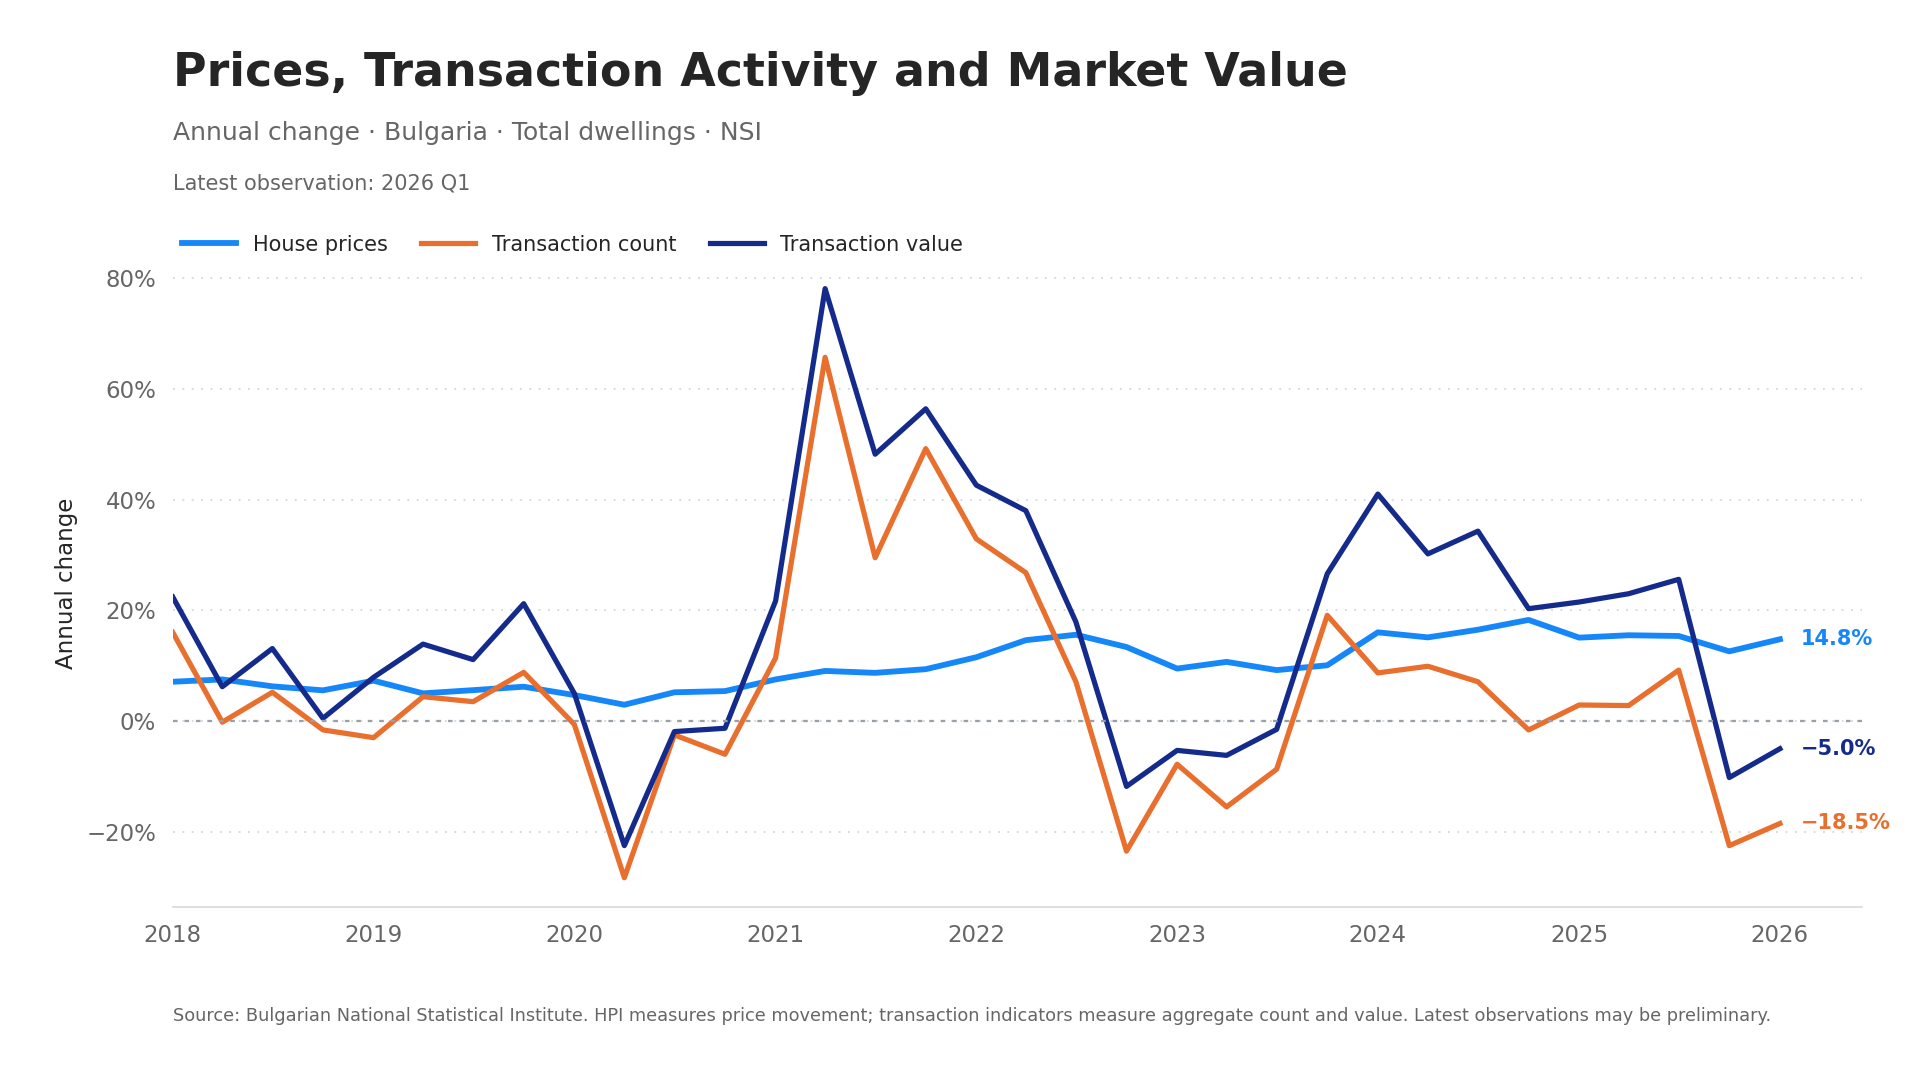
The central divergence remains
Bulgaria's national HPI increased by 15.5% in the year to 2026 Q2. Over the same period, transaction count fell by 18.1% and aggregate transaction value fell by 5.8%.
Value held up materially better than volume. Taken together, the transaction series imply a 15.0% increase in value per transaction. This is a useful indicator of the mix of completed activity, but it is not an observed average sale price and should not be presented as price-per-square-metre growth.
Credit remains supportive
Outstanding housing-loan stock reached EUR 19.33 billion in August, 25.2% higher than a year earlier. The average rate on new housing loans was 2.42%. Credit growth therefore remains an important support for purchasing capacity, even though the transaction figures suggest that participation has narrowed.
The relationship should be monitored rather than treated as a forecast. Strong credit and strong national HPI growth do not establish the value or suitability of an individual property.
City performance continues to diverge
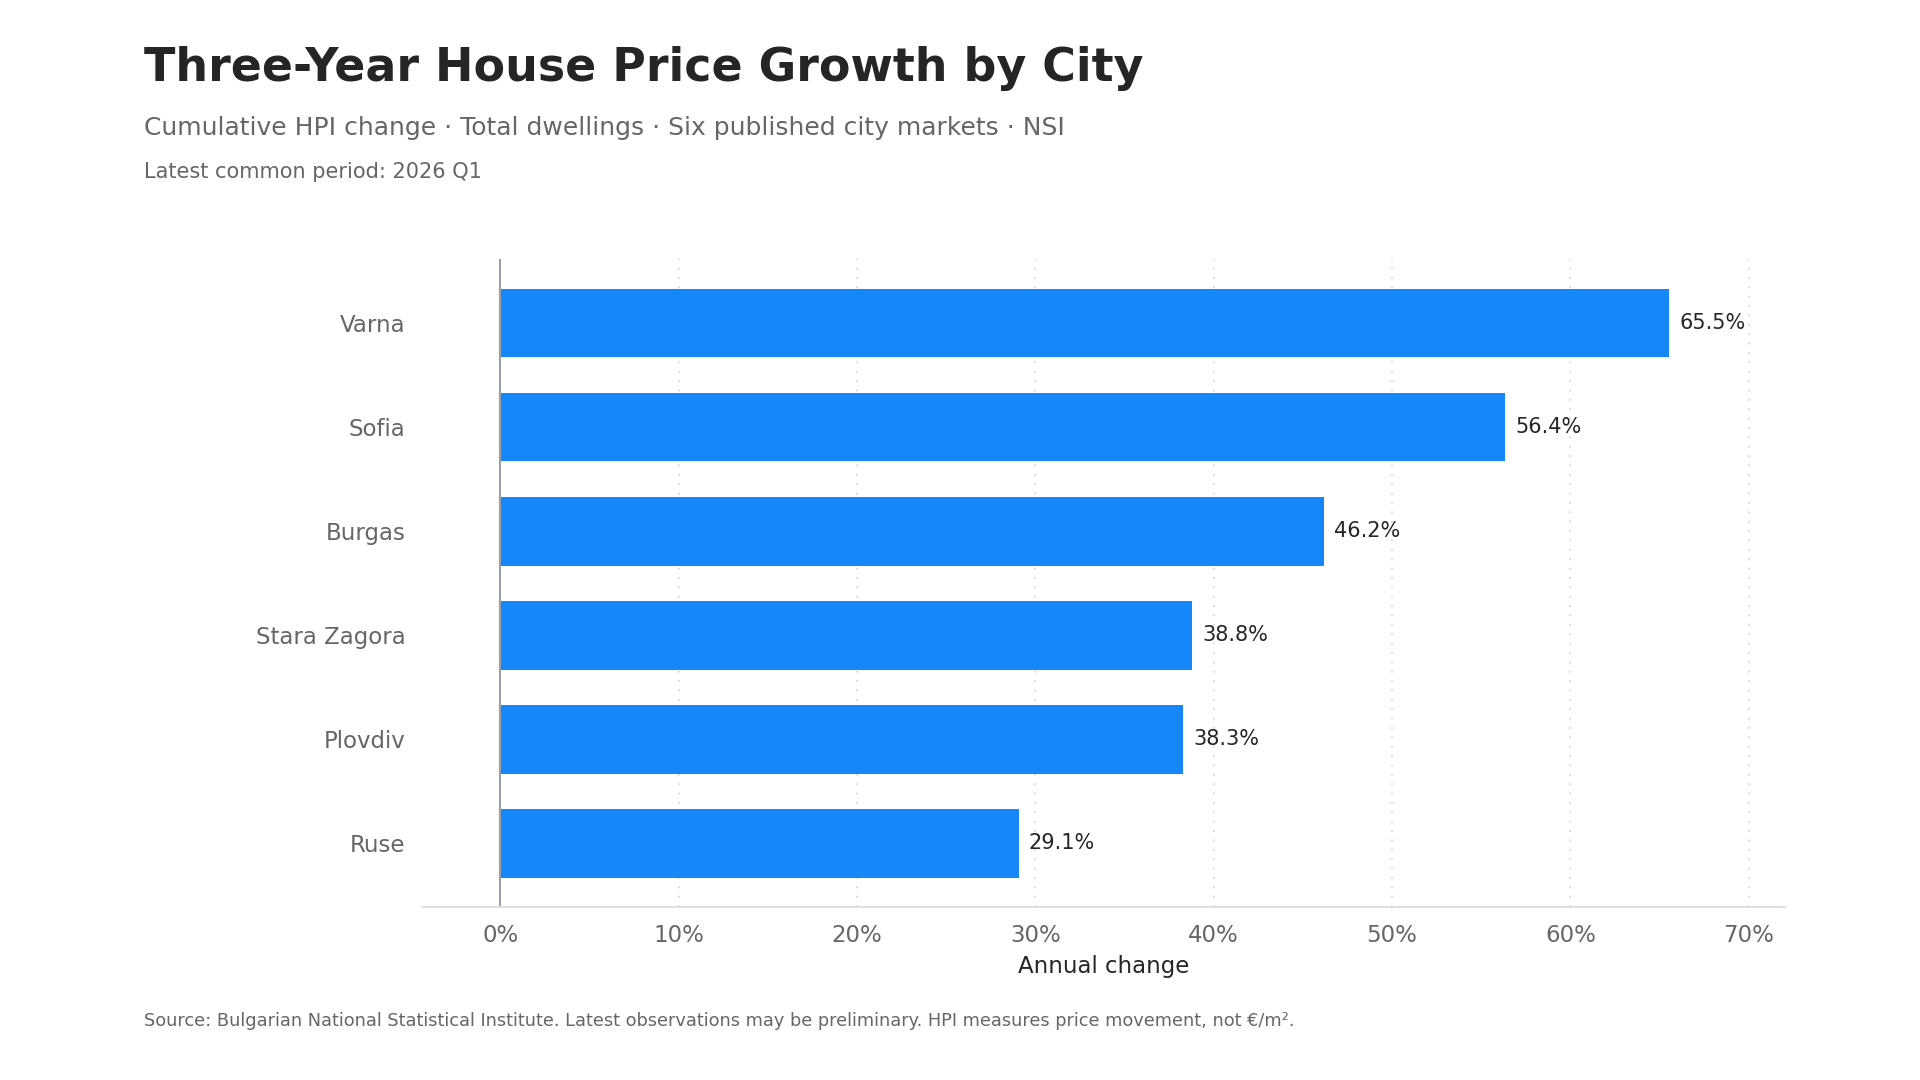
Stara Zagora recorded the strongest latest annual city HPI growth at 15.7%, followed by Varna at 14.3% and Sofia at 13.2%. Plovdiv recorded 11.3%, Burgas 9.1%, and Ruse -0.8%.
The three-year comparison tells a different story. Varna remained first at 57.7%, followed by Sofia at 52.7%. Transaction activity was weakest in several of the markets with strong price records. Plovdiv was the most resilient on transaction count, down 3.3%, and its aggregate transaction value increased by 4.1%.
Supply is expanding, but delivery remains the test
Permitted dwellings increased by 14.0% year on year in 2026 Q2. Construction costs increased by 9.6%. Permits, starts and completions are separate quarterly stages rather than a tracked cohort, so a larger pipeline should not be interpreted as guaranteed near-term supply.
For a buyer or developer, the practical questions remain local: what is actually under construction, which projects are financeable and deliverable, and whether asking prices are supported by comparable evidence.
What this changes for market screening
The latest release strengthens the evidence that headline price growth and broad transaction participation are moving differently. That makes city choice, property type and local comparables more important, not less. The official indicators are best used to frame further investigation rather than to produce a national buy or sell conclusion.
Sources: Bulgarian National Statistical Institute and European Central Bank. Latest observations may be preliminary. HPI measures price movement rather than an average price or EUR/m2. Interpretations identify relationships in the published indicators and do not constitute forecasts or investment advice.