+14.8%
House prices
2026 Q1 · NSI
Annual change in the national HPI. This is price movement, not an average price.The principal indicators in one place. This page is designed for an initial market reading before city, neighbourhood and property-level research begins.
Prices, activity and credit use their latest available official periods.
2026 Q1 · NSI
Annual change in the national HPI. This is price movement, not an average price.2026 Q1 · NSI
Annual change in the number of completed dwelling transactions.Jul 2026 · ECB
Interest rate on new Bulgarian housing loans.Jul 2026 · ECB
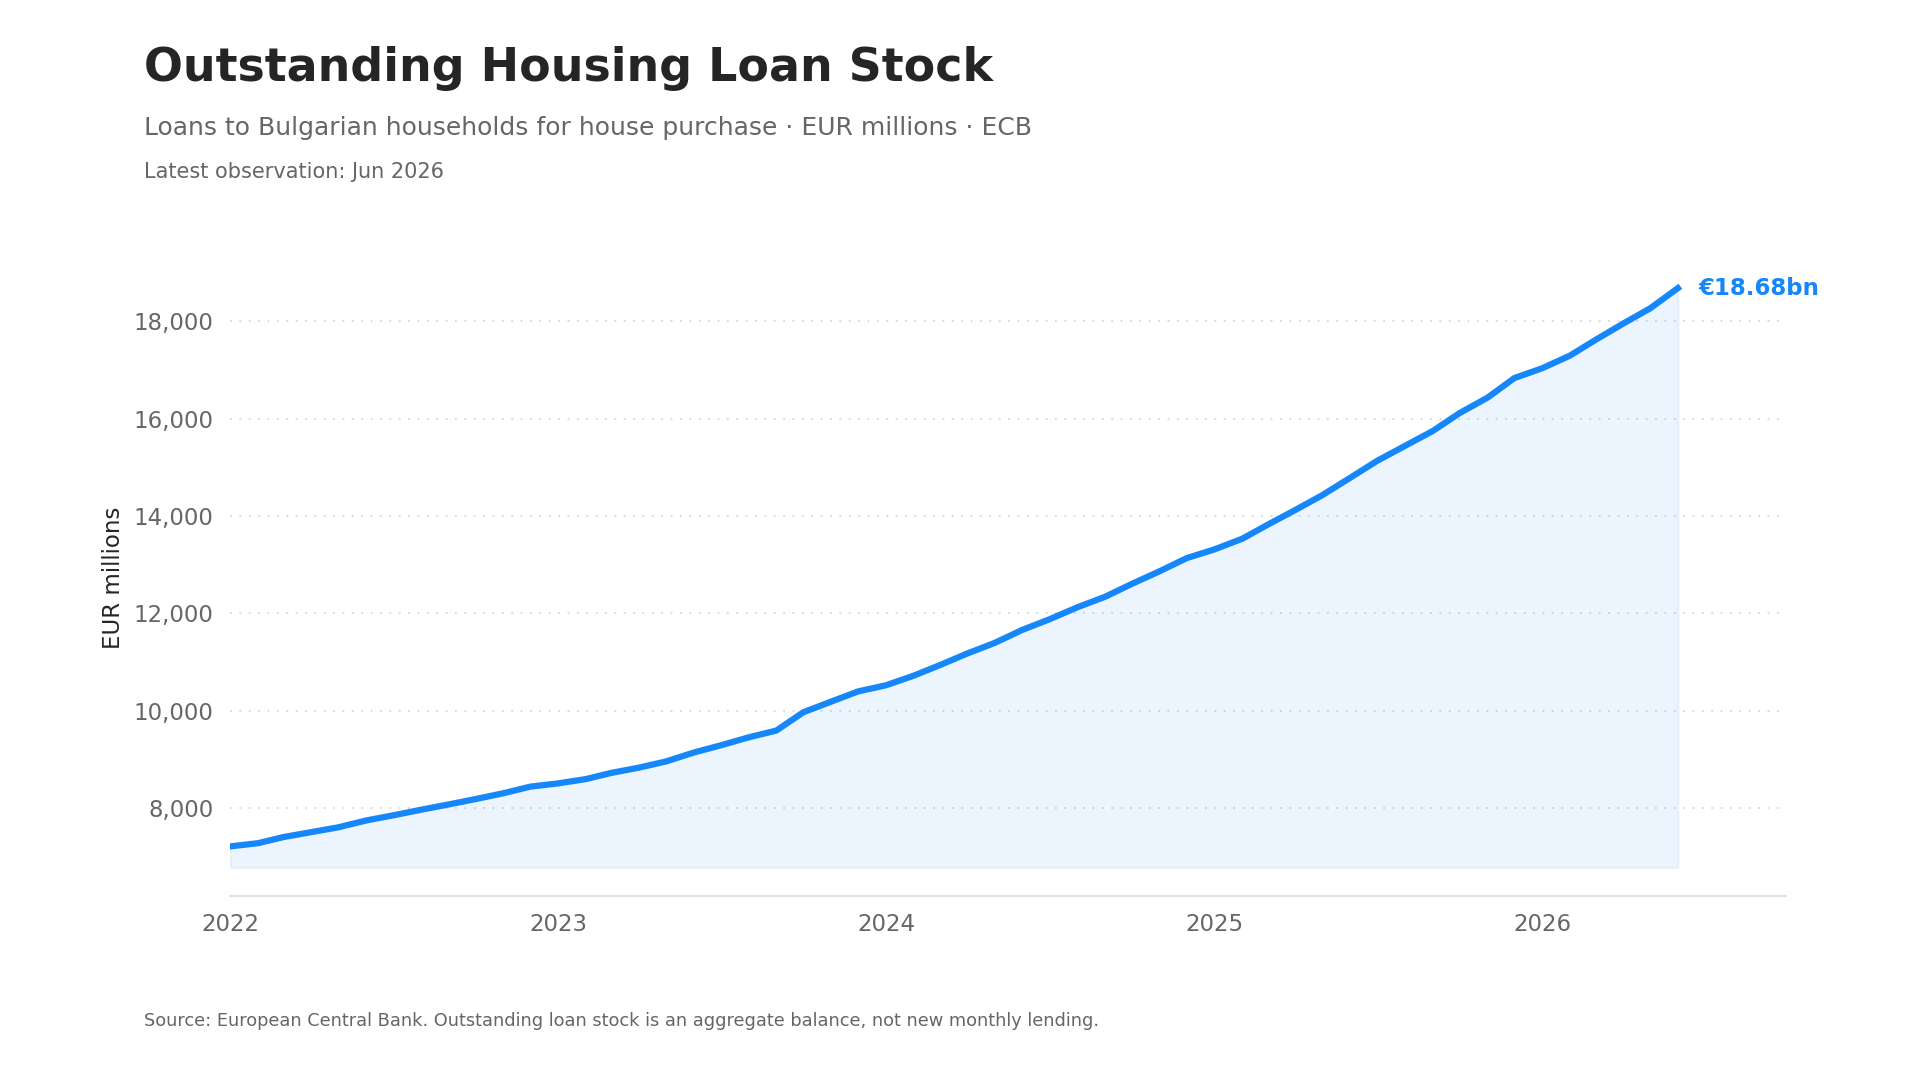
Outstanding Bulgarian housing credit. The trend chart shows the level in EUR millions.Hover over a line, or tap a point on mobile, to see the exact period and value.
Total dwellings · Eurostat
Bulgaria · Total, new and existing dwellings · NSI
Bulgaria · Monthly average · ECB
Bulgaria · EUR millions · ECB
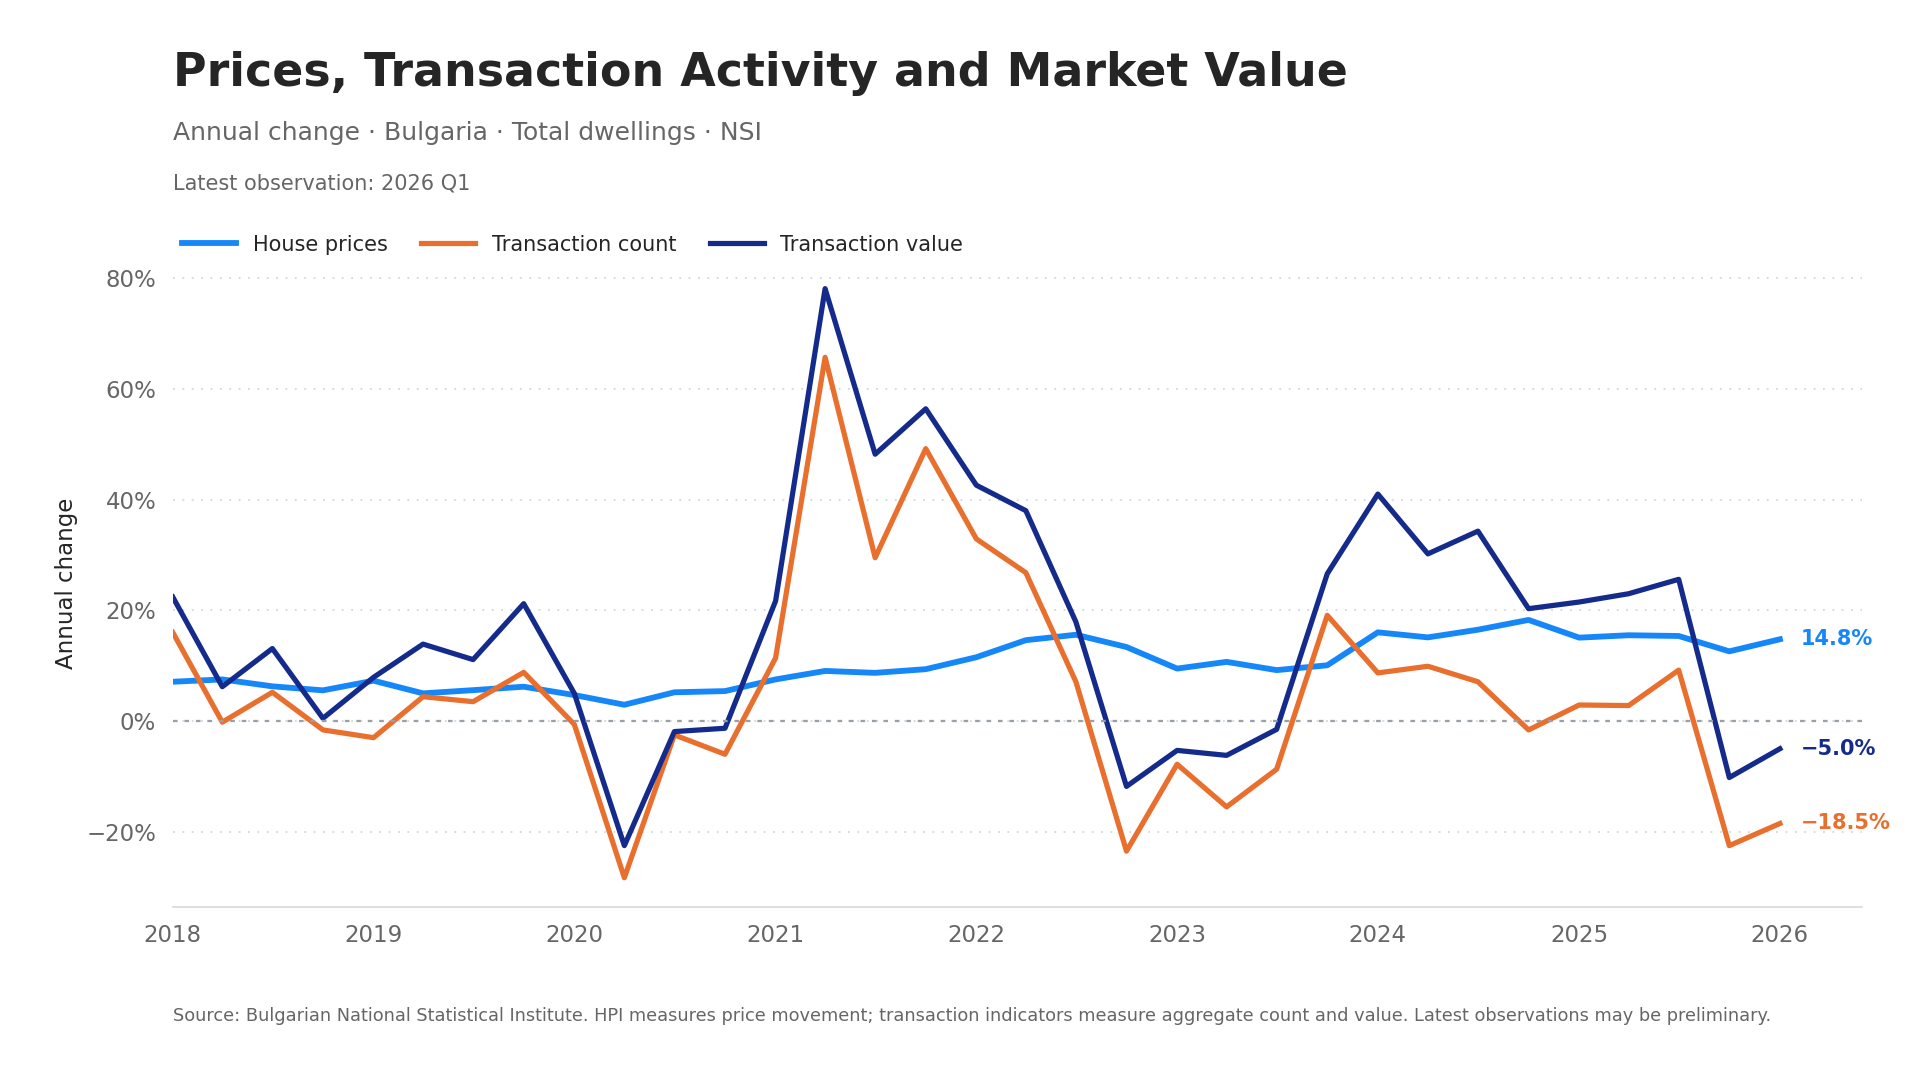
House prices rose 14.8% while transaction count fell 18.5%. Aggregate transaction value declined by only 5.0%, which is consistent with a higher-value mix among the deals that did complete. It does not prove that the average Bulgarian property became 16.6% more expensive.
Housing credit expanded by 25.7% in the year to July. Permitted dwellings increased by 14.0% in 2026 Q2 while construction costs rose by 9.6%. Planned supply is growing, but the cost and timing of delivery remain important.
A Buyer Market Orientation connects your budget, intended use and preferred locations with the available evidence, then identifies the questions requiring local and property-level investigation.
50-minute online consultation · written summary · £95 introductory fee
Sources: Bulgarian National Statistical Institute and European Central Bank. Latest periods differ by series and some observations may be preliminary. Interpretations describe current relationships and do not constitute forecasts or investment advice.