Regional house-price growth is broad, but not uniform
All six Bulgarian statistical regions recorded double-digit annual HPI growth in 2026 Q1. The direction is broad, but the 5.7 percentage point gap between the strongest and weakest regions still gives buyers useful context.
Is Bulgaria's latest house-price growth concentrated in one part of the country, or is it visible across the regional market?
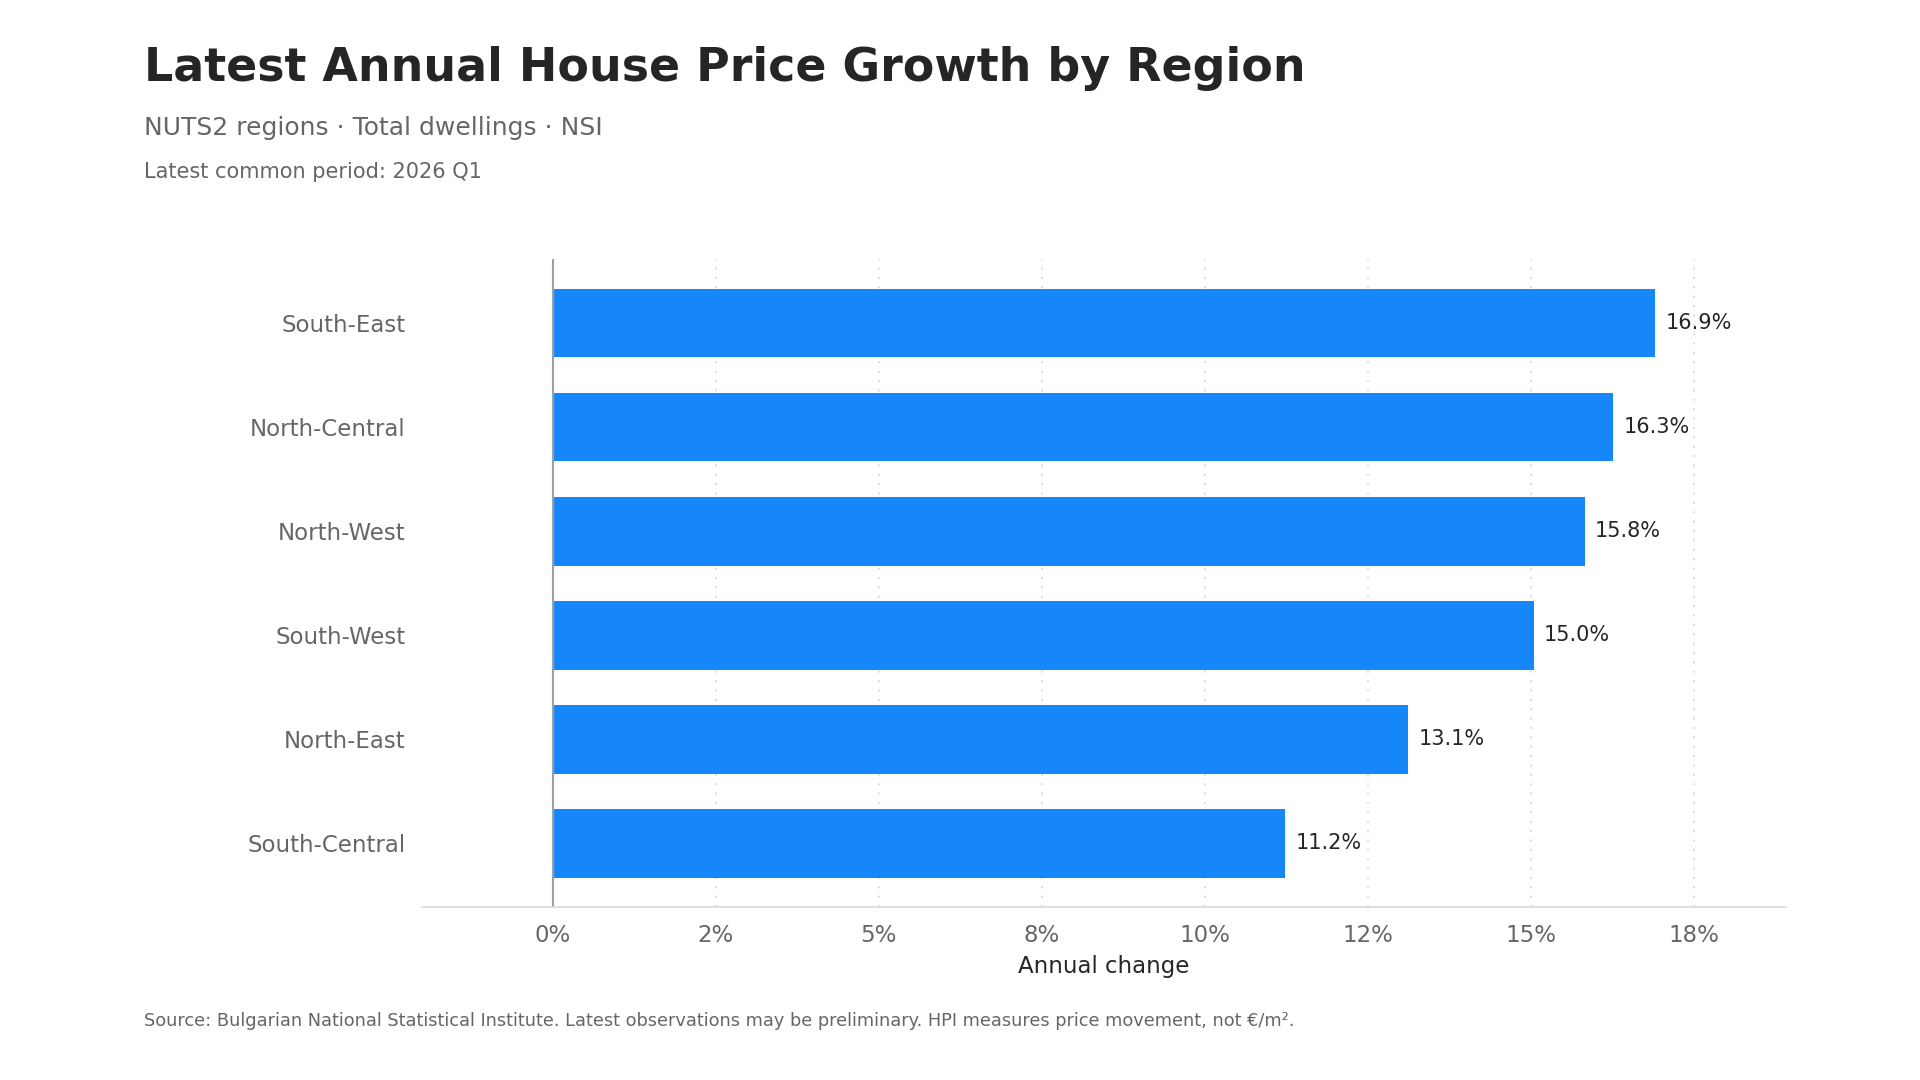
Growth extends across all six regions
Annual HPI growth ranged from 11.2% in South-Central Bulgaria to 16.9% in South-East Bulgaria. North-Central recorded 16.3%, North-West 15.8%, South-West 15.0% and North-East 13.1%.
The national increase was therefore not produced by one region moving sharply while the rest stood still. Price growth was widespread. The differences between regions remain useful, but they are differences in pace rather than direction.
Use the regional ranking as context
NUTS2 regions are large statistical areas. South-East and South-West each contain several distinct local markets. Their growth rates provide a useful backdrop, but they do not describe the price level or recent activity of every city, district or neighbourhood within them.
Burgas can be compared with the five other cities for which NSI publishes a city HPI. South-East Bulgaria answers a broader question about the surrounding region. The two views work best together rather than as substitutes.
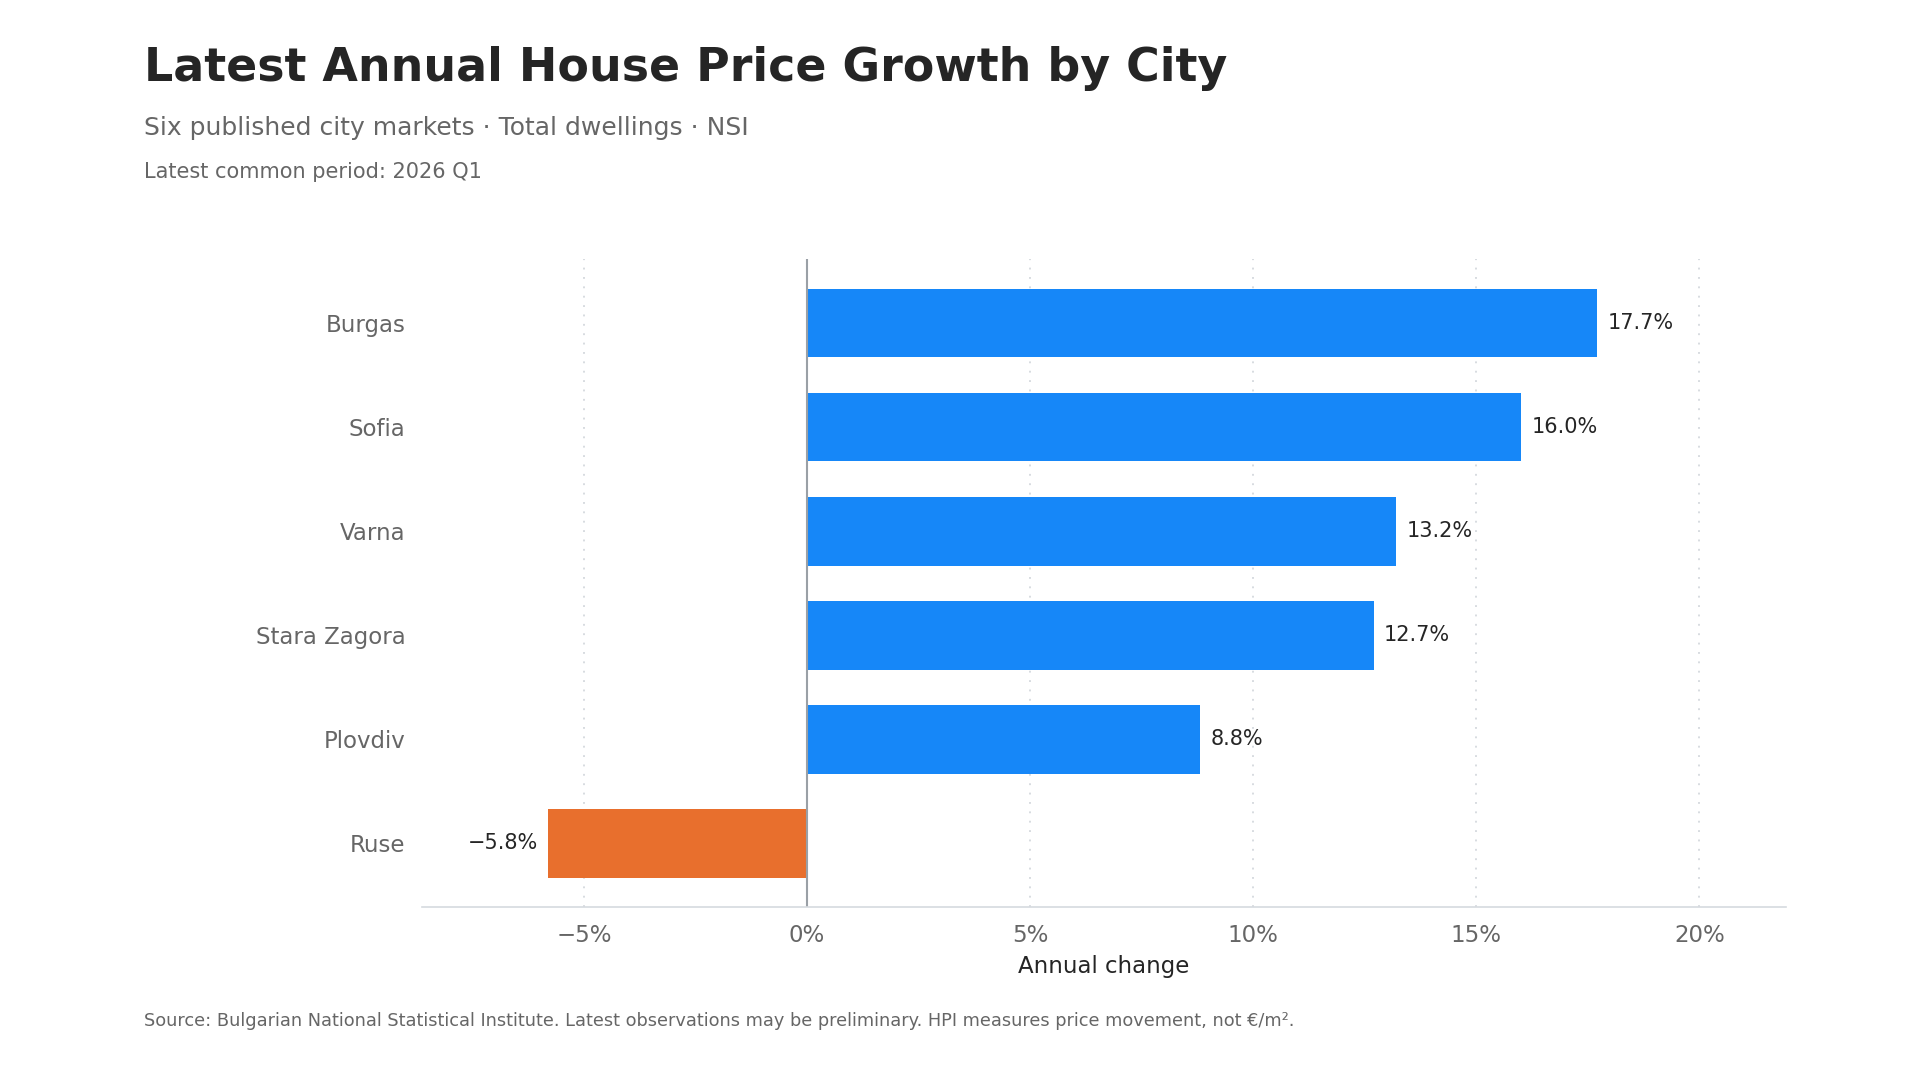
City evidence narrows the comparison
The six-city results are more dispersed than the regional picture. Burgas recorded annual HPI growth of 17.7% and Sofia 16.0%, while Ruse recorded a decline of 5.8%. A positive regional result can therefore coexist with a weaker published city result inside the same broad area.
For an international buyer, the sensible sequence is to use regional evidence for context, city data to narrow the field and local asking-price, supply and professional evidence for the chosen location. Each layer answers a different part of the decision.
Questions for the next release
- Breadth: whether all six regions continue to record positive annual growth.
- Dispersion: whether the range between the strongest and weakest region widens.
- City differences: whether weak city results persist despite positive regional growth.
- Activity: whether transaction participation begins to confirm the price direction.
Source: Bulgarian National Statistical Institute. Total-dwelling HPI, 2026 Q1. Latest observations may be preliminary.
Need to narrow a regional question?
A focused screen can combine the available regional, city, district and supply indicators before local evidence is commissioned.
Ask about a regional market screen →