Price growth and liquidity are telling different city stories
Varna leads the three-year price comparison, while Plovdiv has the strongest latest transaction position. The difference matters because price momentum and the ease of finding an active market are not the same thing.
Which major Bulgarian city markets combine price momentum with evidence of continuing transaction participation?
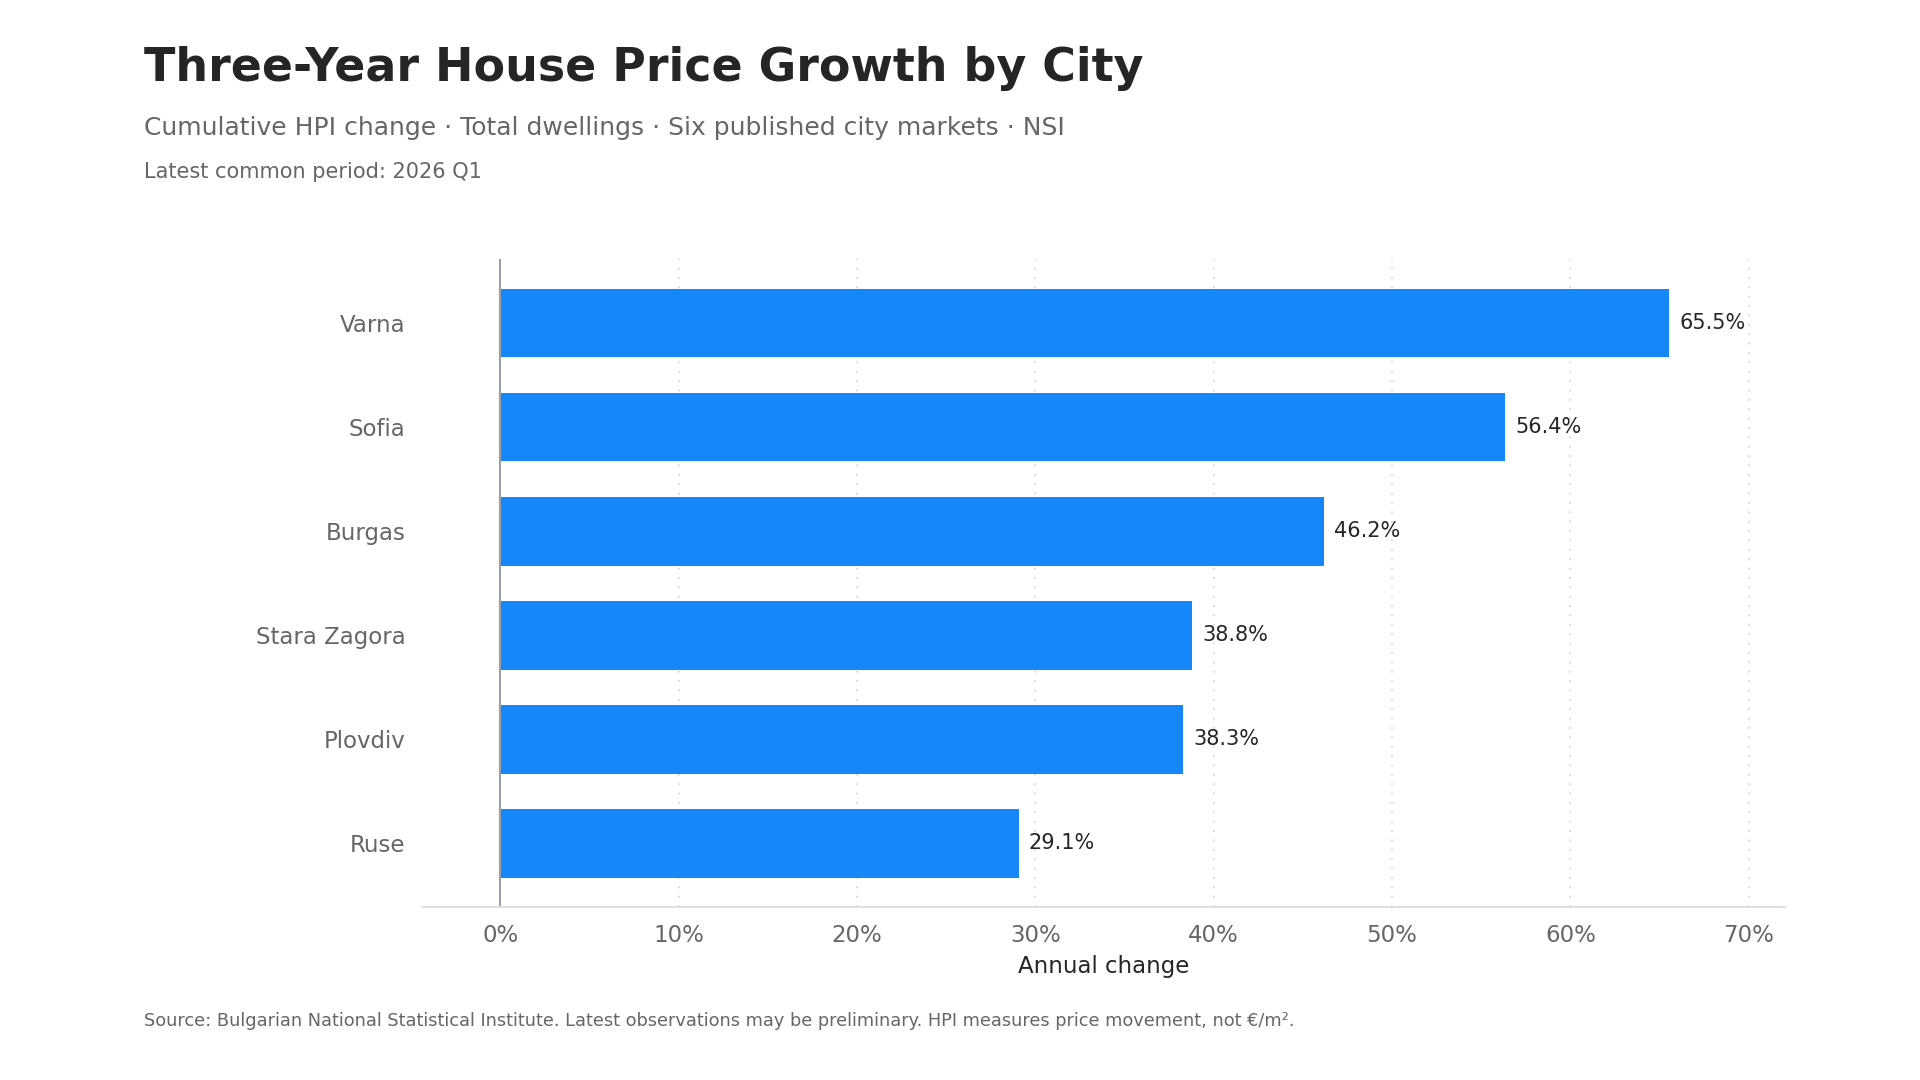
Varna and Sofia lead the longer price comparison
Varna recorded the strongest three-year HPI growth among the six published city markets, at 65.5%. Sofia followed at 56.4%, with Burgas at 46.2%. Stara Zagora and Plovdiv were close together at 38.8% and 38.3%, while Ruse recorded 29.1%.
This is a useful measure of momentum, not a complete ranking of investment prospects. It says nothing about the price per square metre, rental yield, neighbourhood supply or the quality of an individual property. Its value is in showing which cities have moved furthest before those local questions are examined.
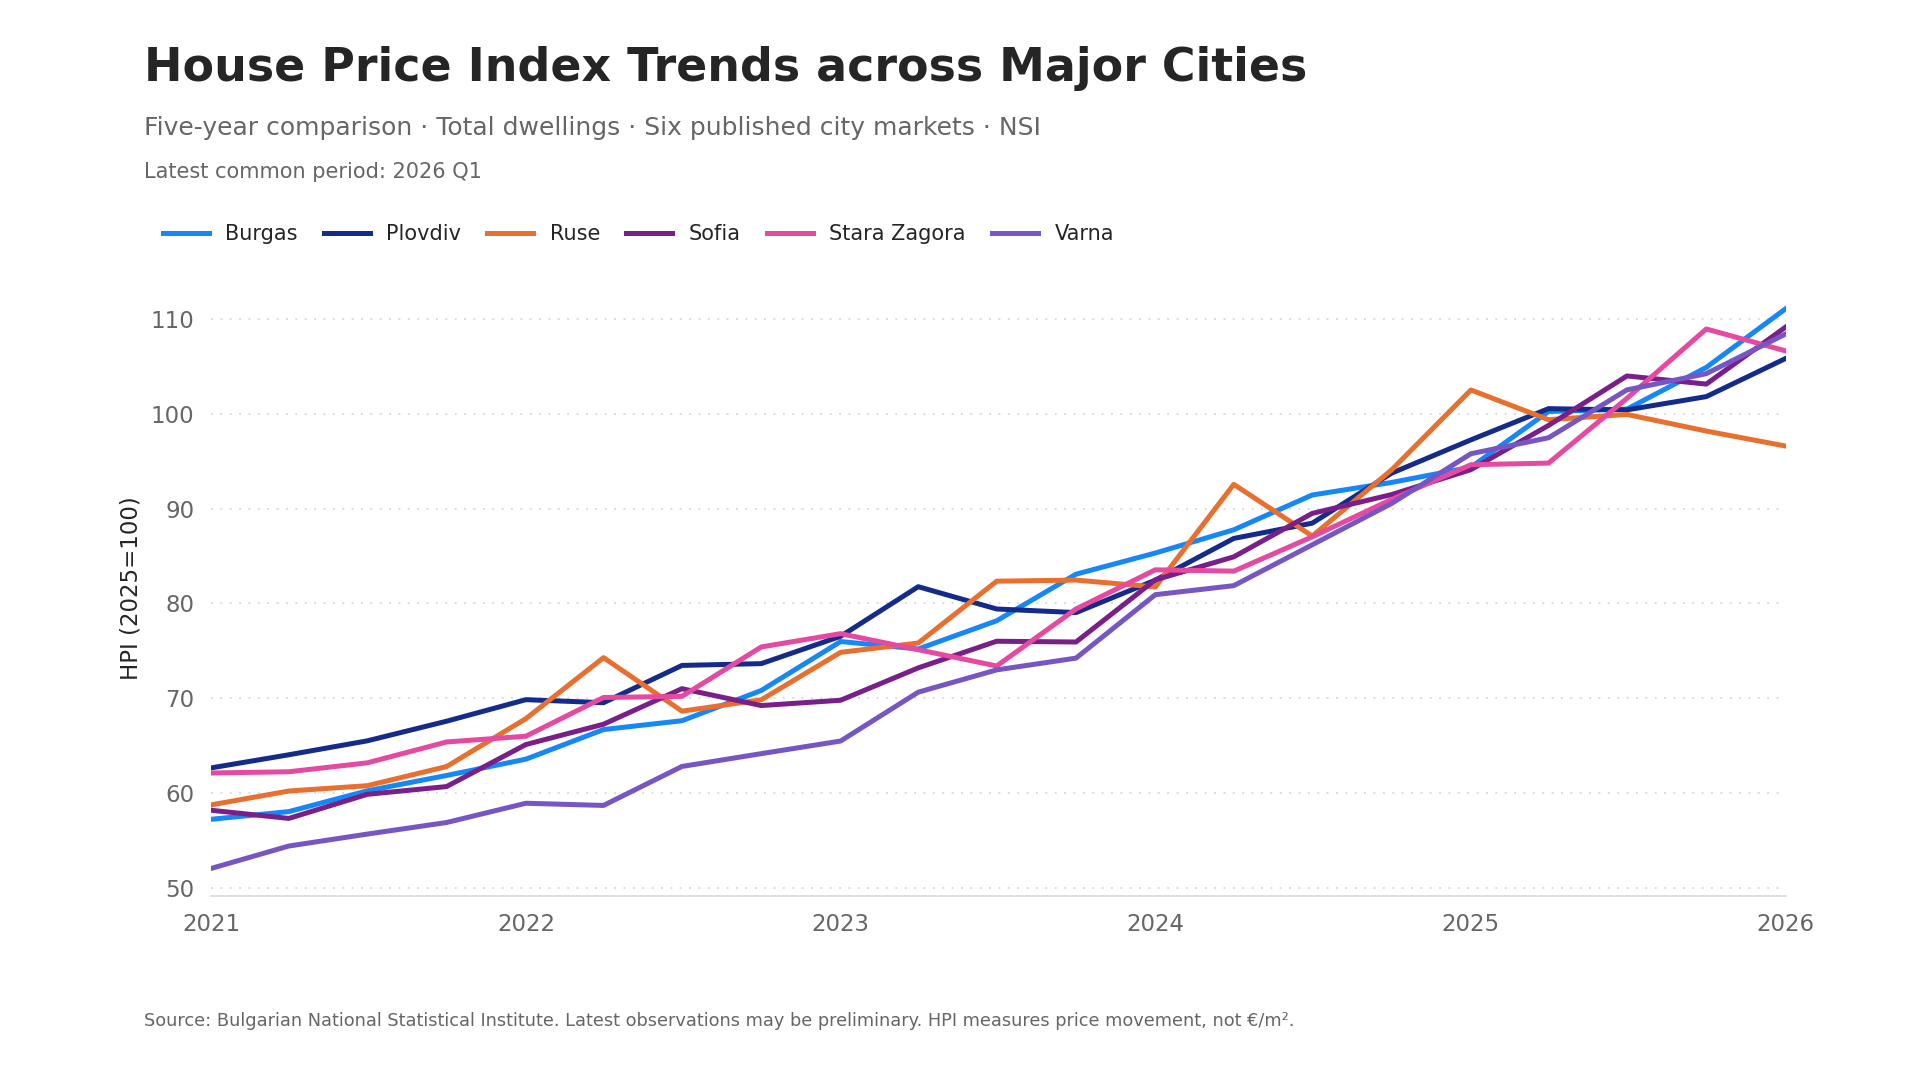
The latest year tells a different story
Annual HPI growth in 2026 Q1 was strongest in Burgas at 17.7%, followed by Sofia at 16.0% and Varna at 13.2%. Plovdiv recorded 8.8%. Ruse was the clear exception, with its total-dwelling index down 5.8% from a year earlier.
Varna’s three-year lead and Burgas’s stronger latest annual result are both correct. One describes the longer move; the other shows recent pace. A buyer comparing the two would want to know whether that recent pace is supported by transaction activity.
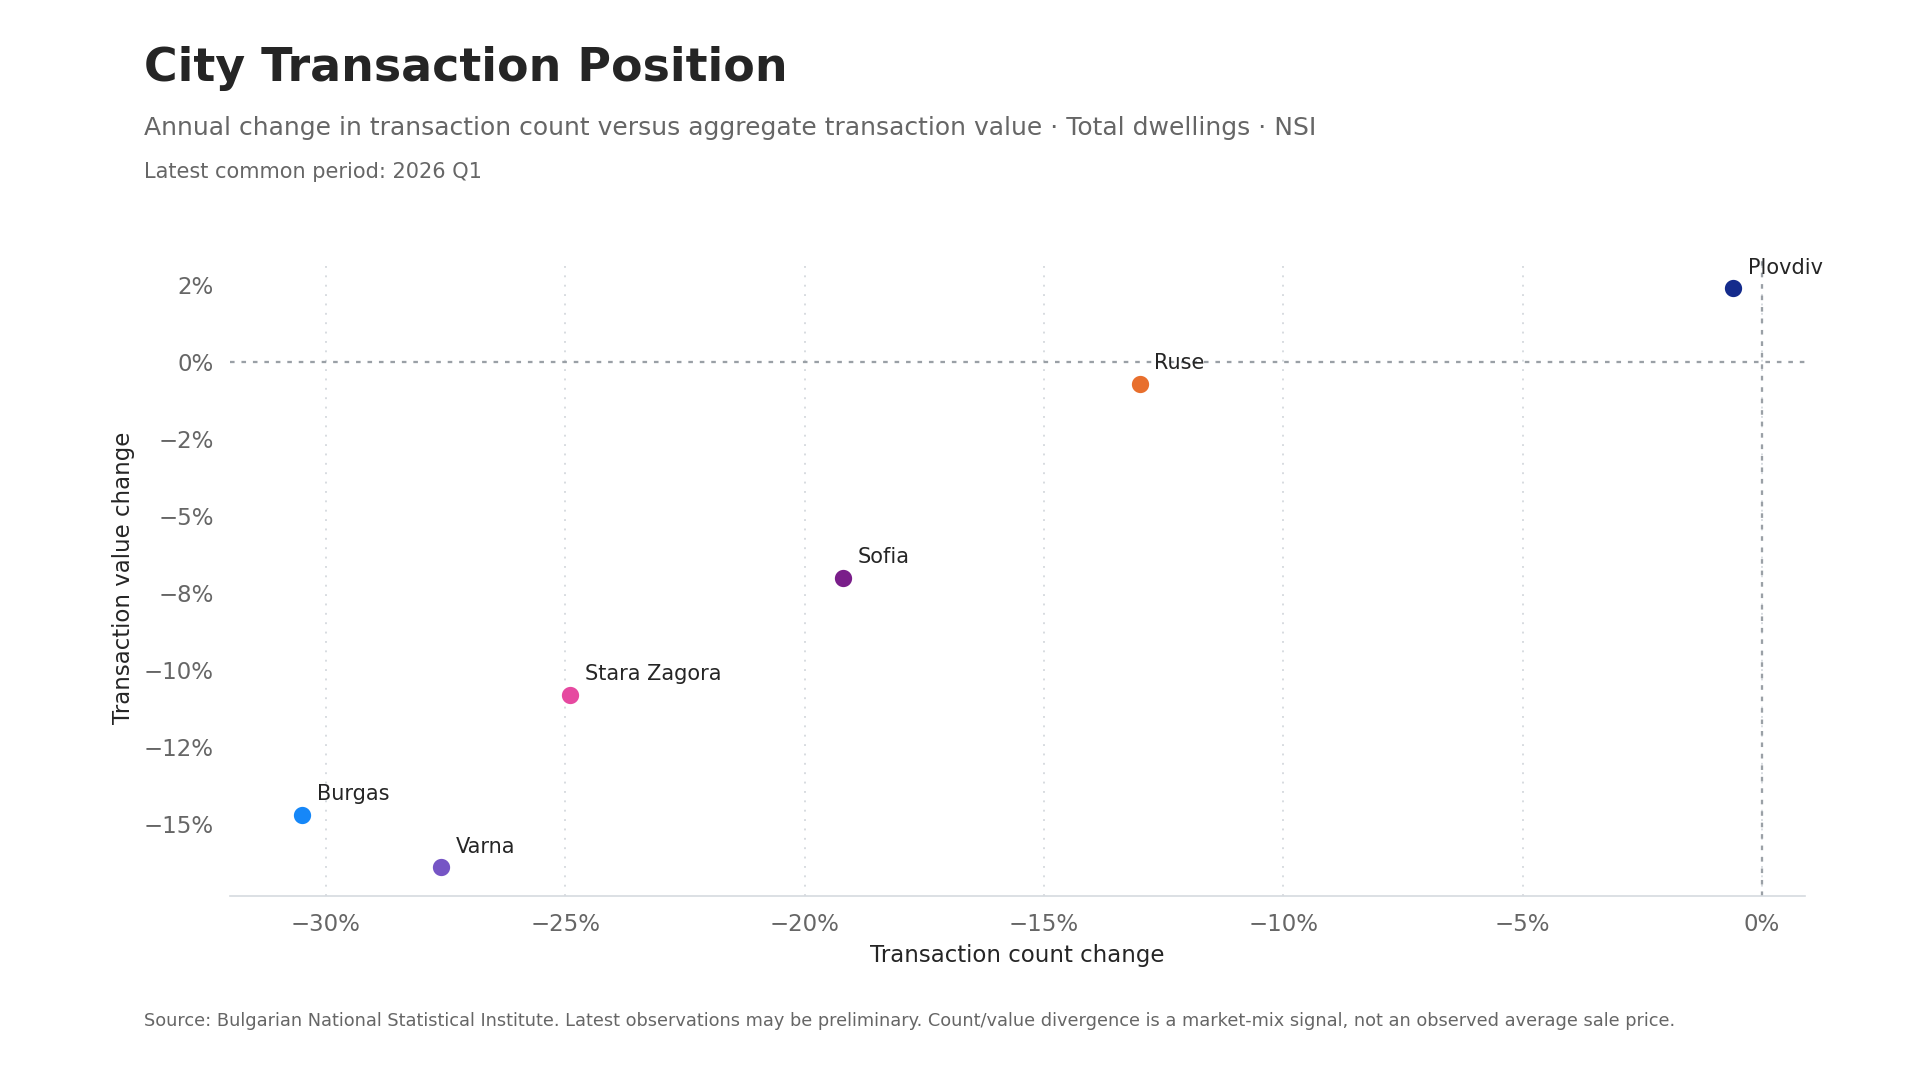
Price momentum is not the same as market breadth
Plovdiv’s transaction count was almost unchanged from a year earlier, down 0.6%, while aggregate transaction value increased 2.4%. It was the only one of the six cities with positive transaction-value growth in the latest comparison.
Burgas and Varna, despite strong price histories, recorded much sharper falls in transaction count, at 30.5% and 27.6% respectively. Aggregate values also fell, but by less than transaction counts. That is consistent with a higher-value mix among completed deals, although the published totals cannot tell us whether this reflects size, quality, location or price.
Sofia sits between these cases: annual HPI growth remained strong, while both transaction measures declined. The practical reading is price resilience without equally broad participation. That deserves investigation before strong headline growth is treated as evidence of an easy market to enter or exit.
What deserves closer investigation?
- Varna: whether strong multi-year price growth can be reconciled with the latest contraction in transaction activity.
- Plovdiv: whether relative transaction resilience continues and which local segments account for it.
- Burgas: whether recent price strength persists as transaction participation weakens.
- Ruse: whether the latest annual HPI decline is temporary, compositional or part of a more persistent change.
Source: Bulgarian National Statistical Institute. City HPI and transaction indicators cover Burgas, Plovdiv, Ruse, Sofia, Stara Zagora and Varna. Latest observations may be preliminary.
Comparing two Bulgarian city markets?
The official indicators can be assembled into a focused market screen before local property and neighbourhood research begins.
Request a city comparison →