Burgas
+17.7% YoYStrong price momentum alongside a marked contraction in transaction count.
- 3-year HPI
- +46.2%
- Transactions
- −30.5%
Use price momentum and transaction activity to identify which market—and which questions—deserve deeper local investigation.
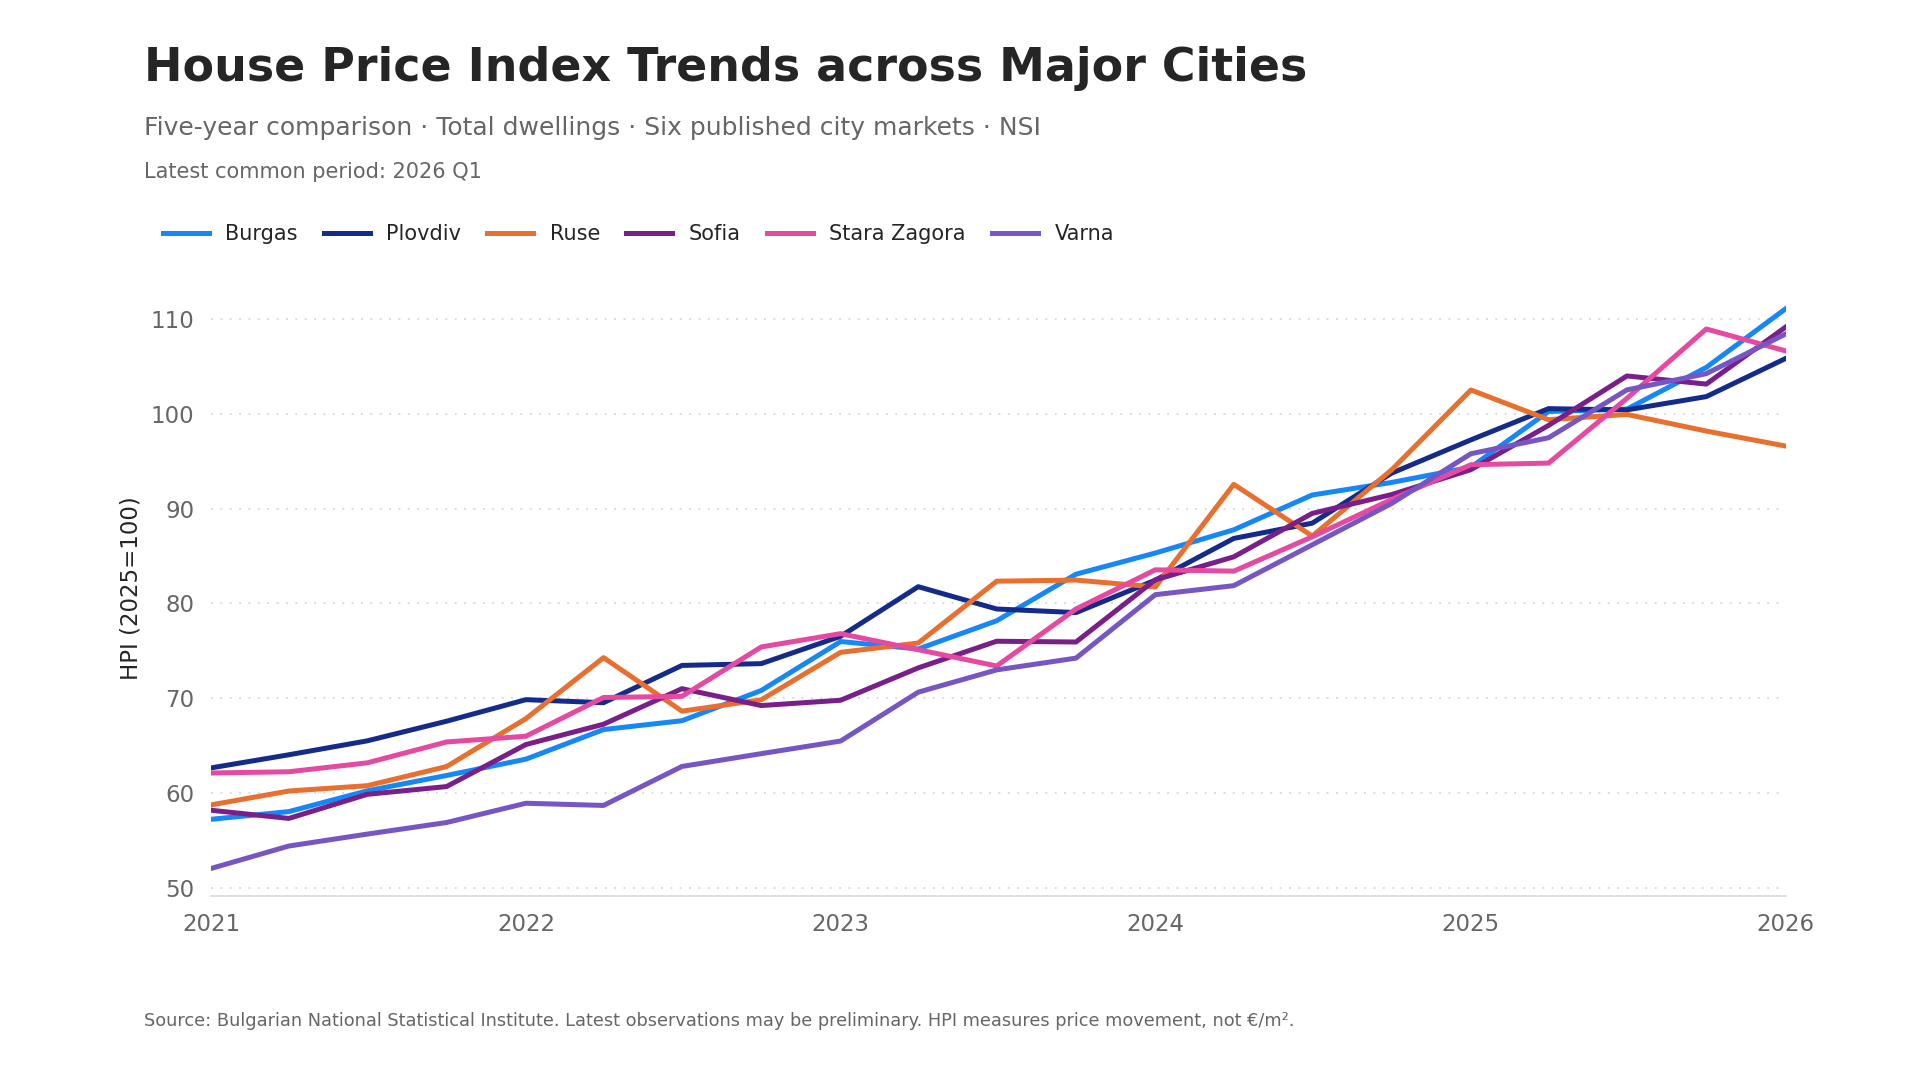
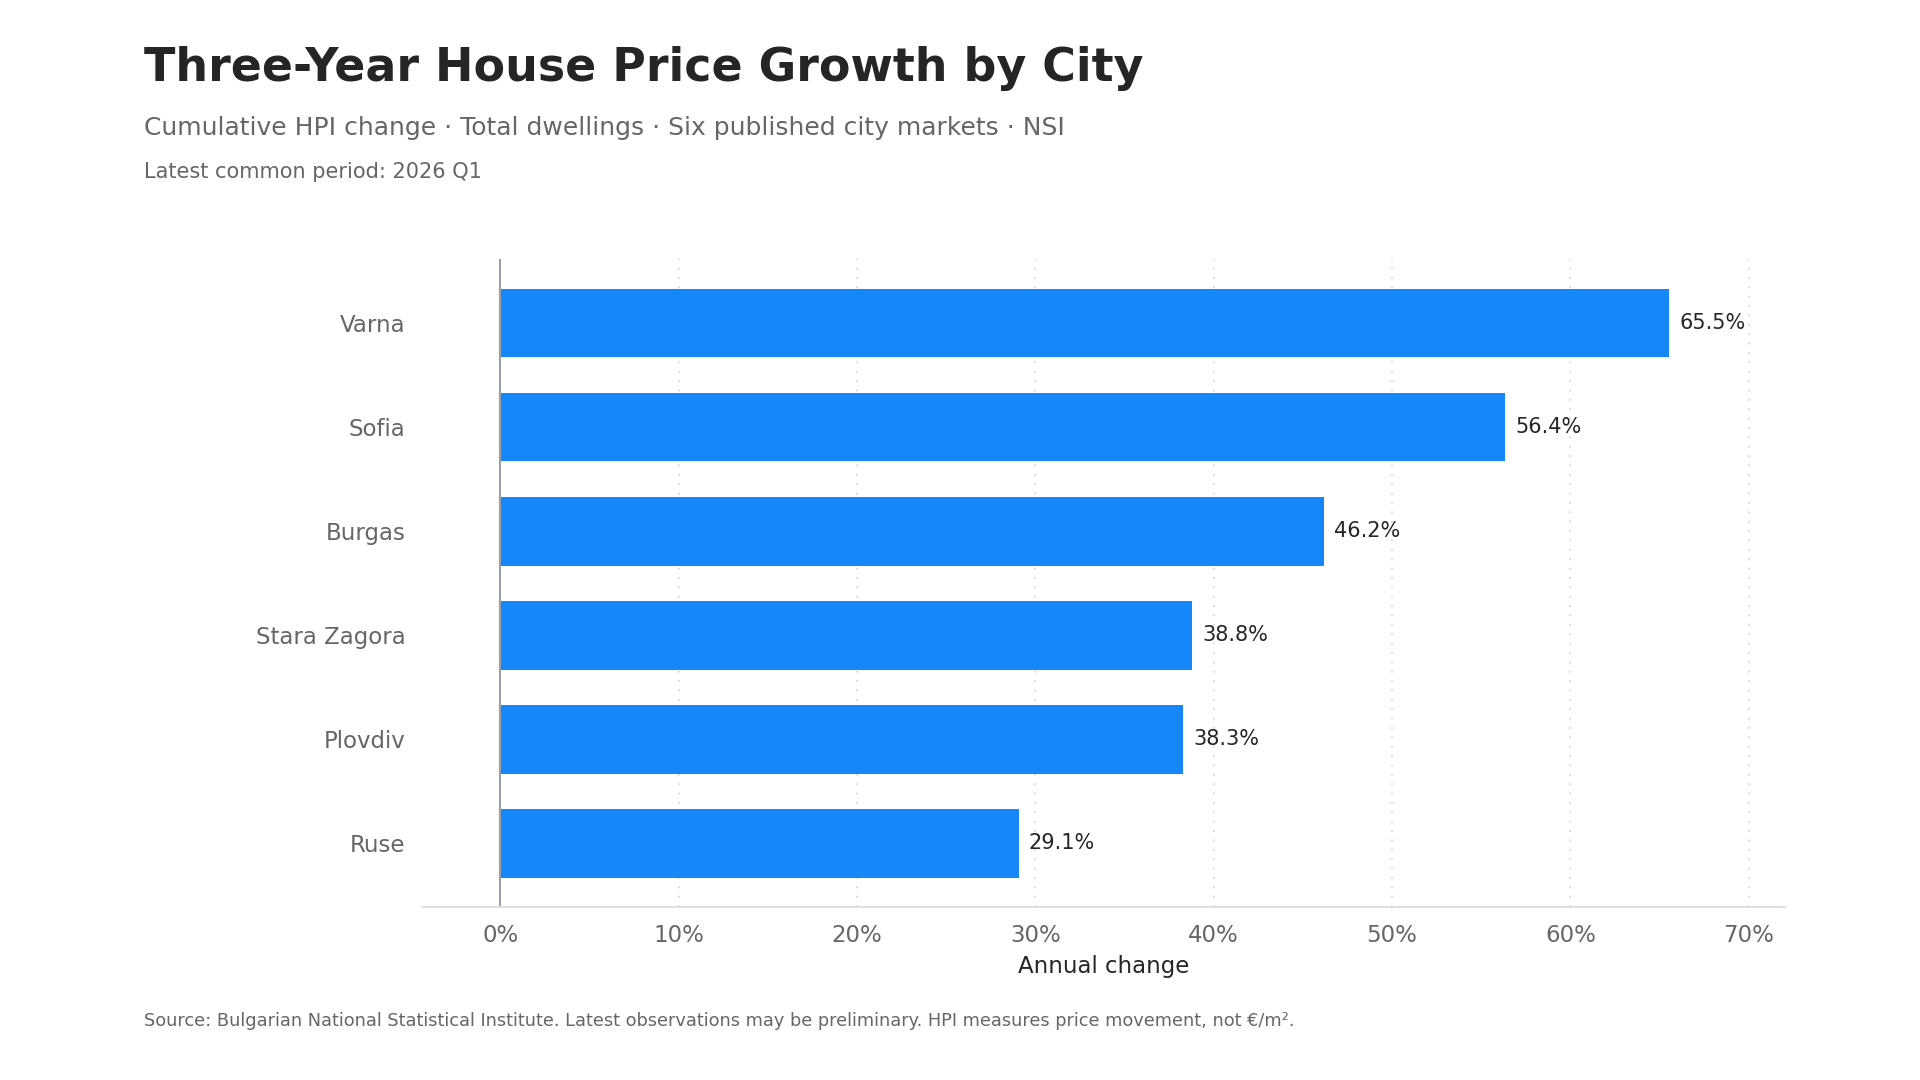
Analytical summaries—not neighbourhood guides or property recommendations.
Strong price momentum alongside a marked contraction in transaction count.
Strong annual and three-year price growth with weaker transaction participation.
The strongest three-year HPI growth, but substantially weaker recent activity.
Positive price momentum with a recent fall in transaction count.
Moderate price growth and the most resilient recent transaction signal.
The weakest total-dwelling signal; new-dwelling HPI has a known data gap.
Future guides may add neighbourhood context, legally reusable imagery and clearly disclosed links to suitable local property professionals.
Official city data does not provide live asking prices, neighbourhood €/m², yields or individual development quality.