A larger housing pipeline does not guarantee completed supply
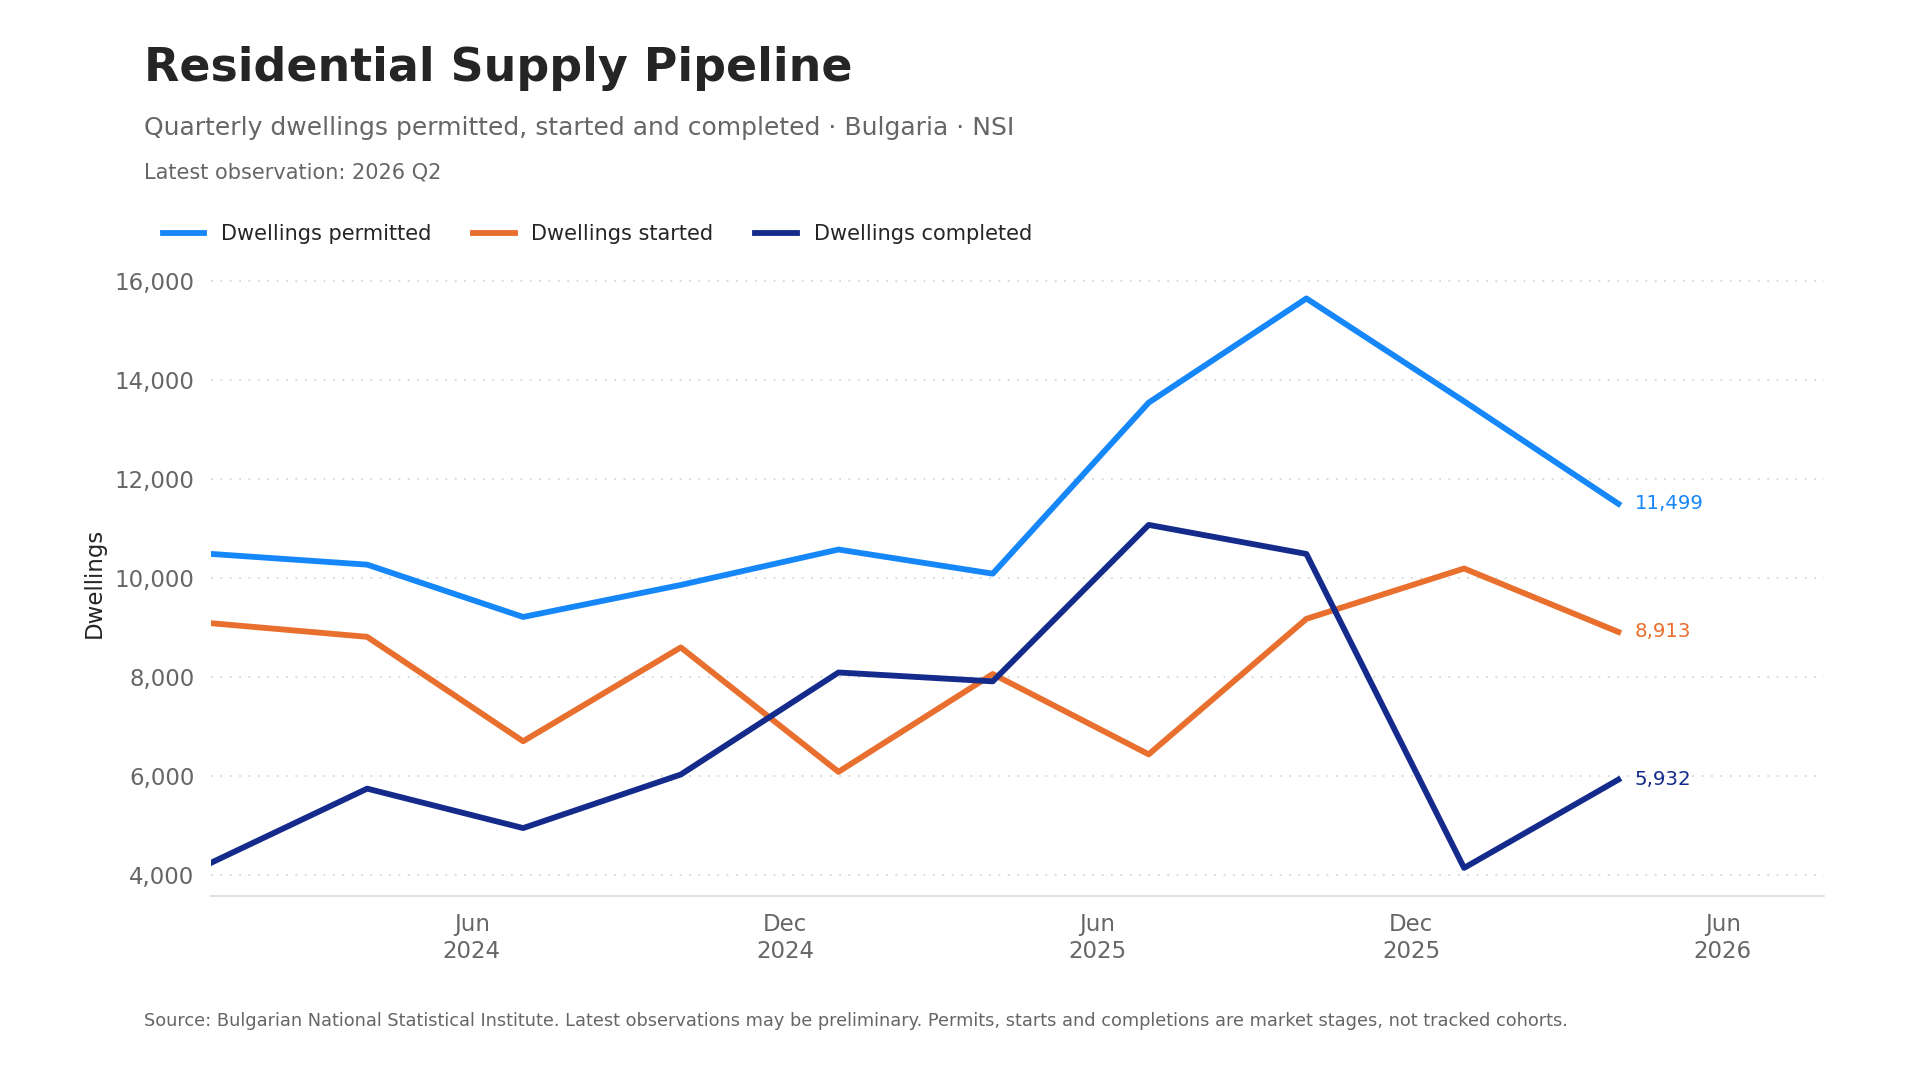
Bulgaria permitted almost twice as many dwellings as it completed in the latest quarter. This points to active development interest, but buyers should not assume that every planned home will reach the market quickly.
Does a larger development pipeline point to materially greater housing supply, or are delivery pressures also building?
The pipeline is active
Preliminary data for 2026 Q2 recorded 11,499 dwellings permitted, 8,913 started and 5,932 completed. Permitted dwellings were 14.0% higher than a year earlier, a clear sign that development interest remains strong.
The gap between the stages is not a cancellation rate. A permit issued this quarter would not normally become a completed home in the same quarter, and the data do not follow individual projects. The better question is whether starts and completions continue to strengthen after the rise in permits.
Completion is the practical test
Permits show intention and starts show that work has begun. Completions are closer to homes actually entering the available stock. For buyers, this means a busy early-stage pipeline may still take time to improve choice or ease pressure in a particular market.
Higher permits create the potential for more supply. That potential becomes more convincing only if starts and completions remain firm in later releases.
Costs complicate delivery
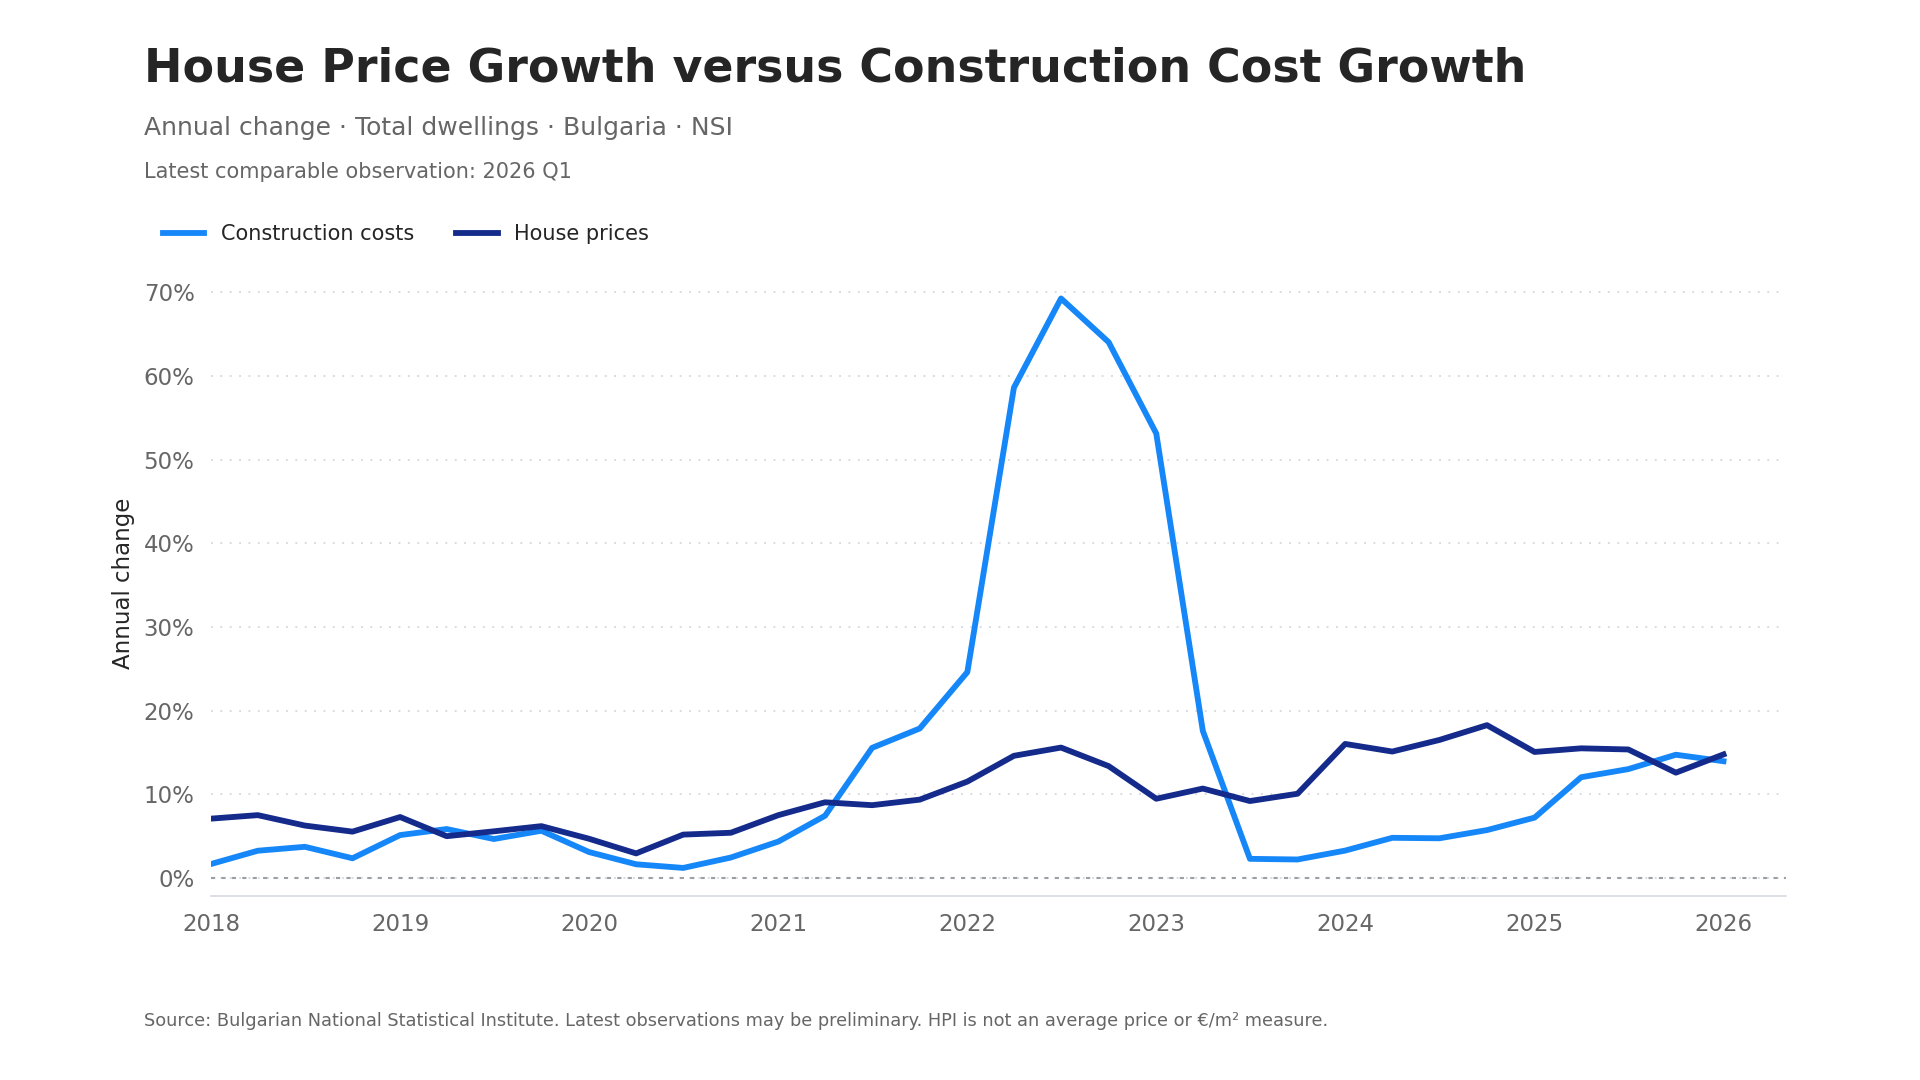
Total construction costs increased 14.0% year on year in 2026 Q1. The index cannot tell us whether a particular development is profitable, but higher costs can affect required selling prices, margins and the timing of construction.
The result is a market with more planned supply and more pressure on the cost of delivering it. For anyone assessing a new-build market, both sides matter: the number of projects coming forward and the conditions under which they can be completed.
What to monitor next
- Starts: whether they remain elevated after the recent rise in permits.
- Completions: whether completed dwellings begin to close some of the gap with earlier pipeline activity.
- Cost components: whether material and labour pressures ease or remain broad.
- District distribution: whether the pipeline is concentrated in a small number of markets rather than spread nationally.
Source: Bulgarian National Statistical Institute. Latest housing-supply observations are preliminary. Construction-cost and housing-supply indicators have different latest periods.
Investigating supply in a particular district?
District-level permit, start and completion indicators can provide an official-data starting point before individual developments are examined.
Ask about district supply research →