Bulgarian residential property: price resilience meets weaker liquidity
House prices and housing credit continued to rise, even as fewer transactions took place. For buyers and market professionals, the important point is that strong prices are no longer being matched by equally broad activity.
Prices remain strong, but the market has narrowed
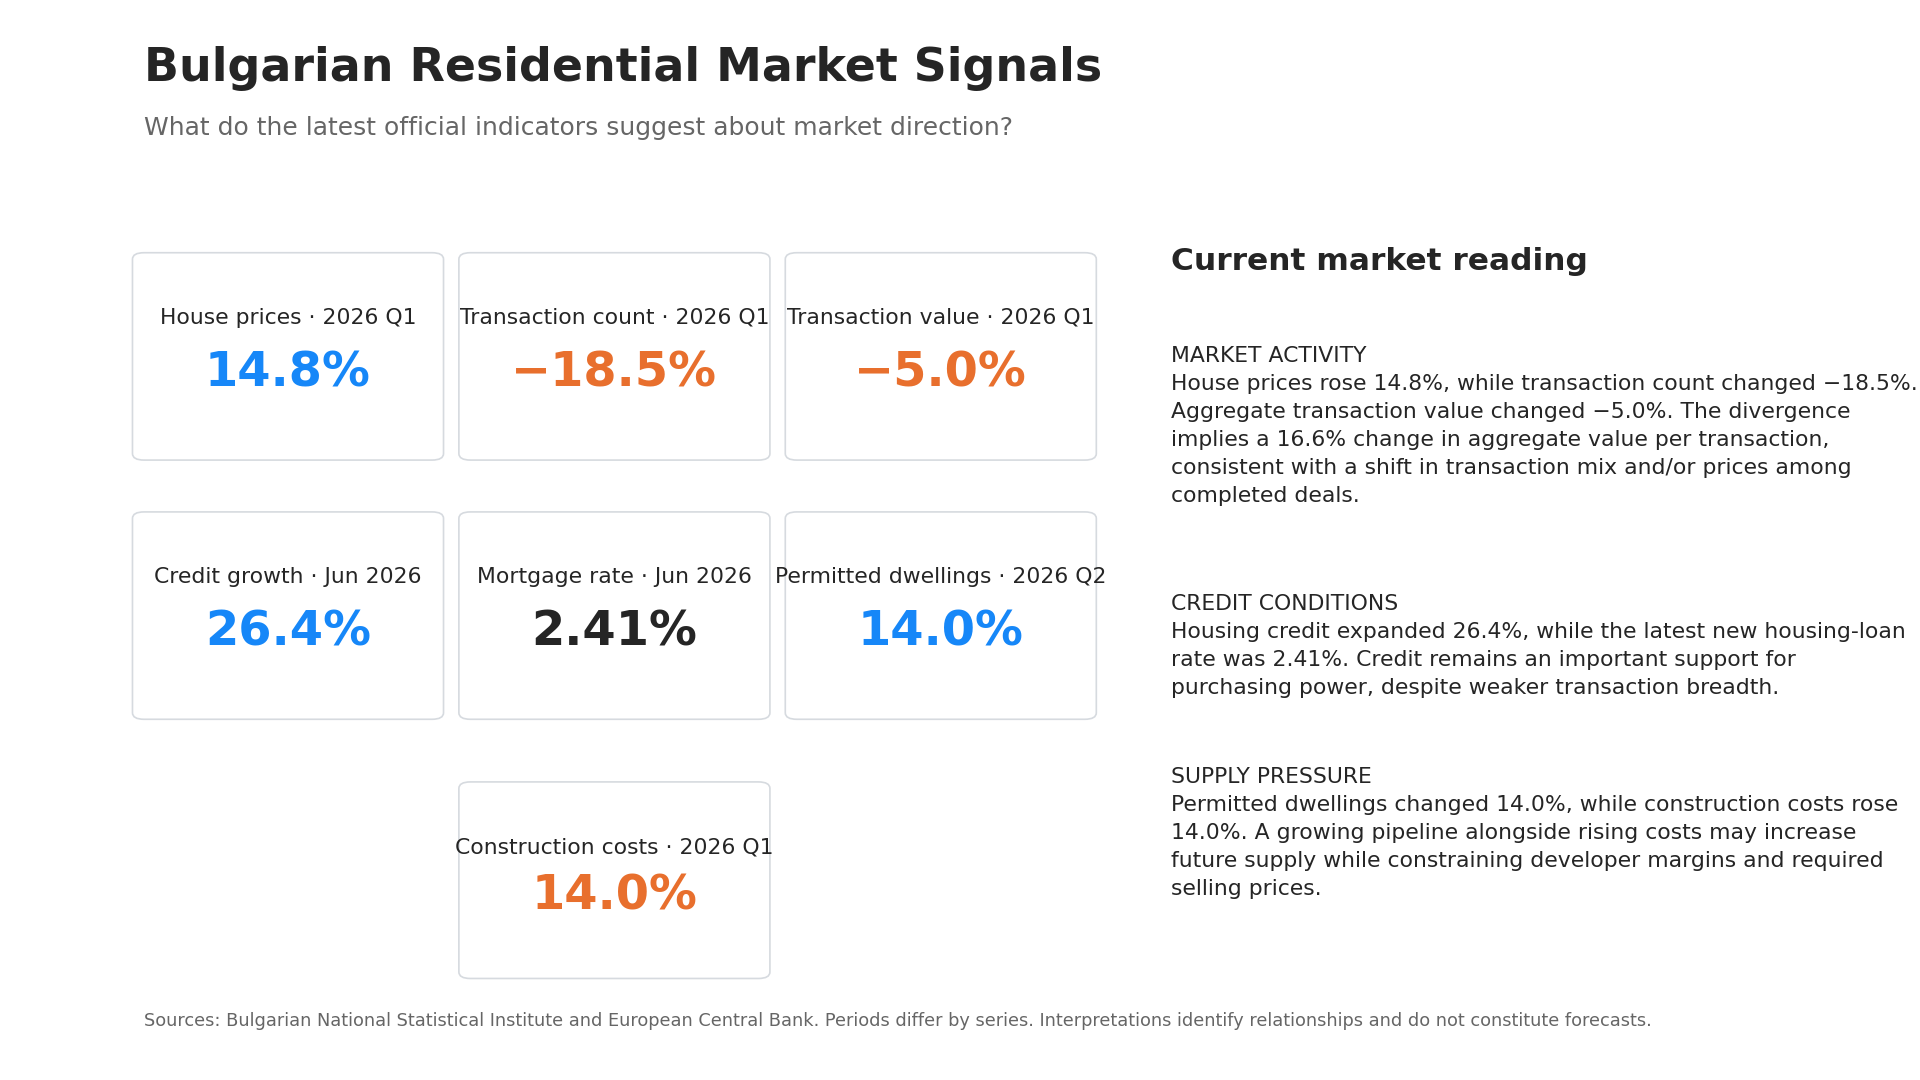
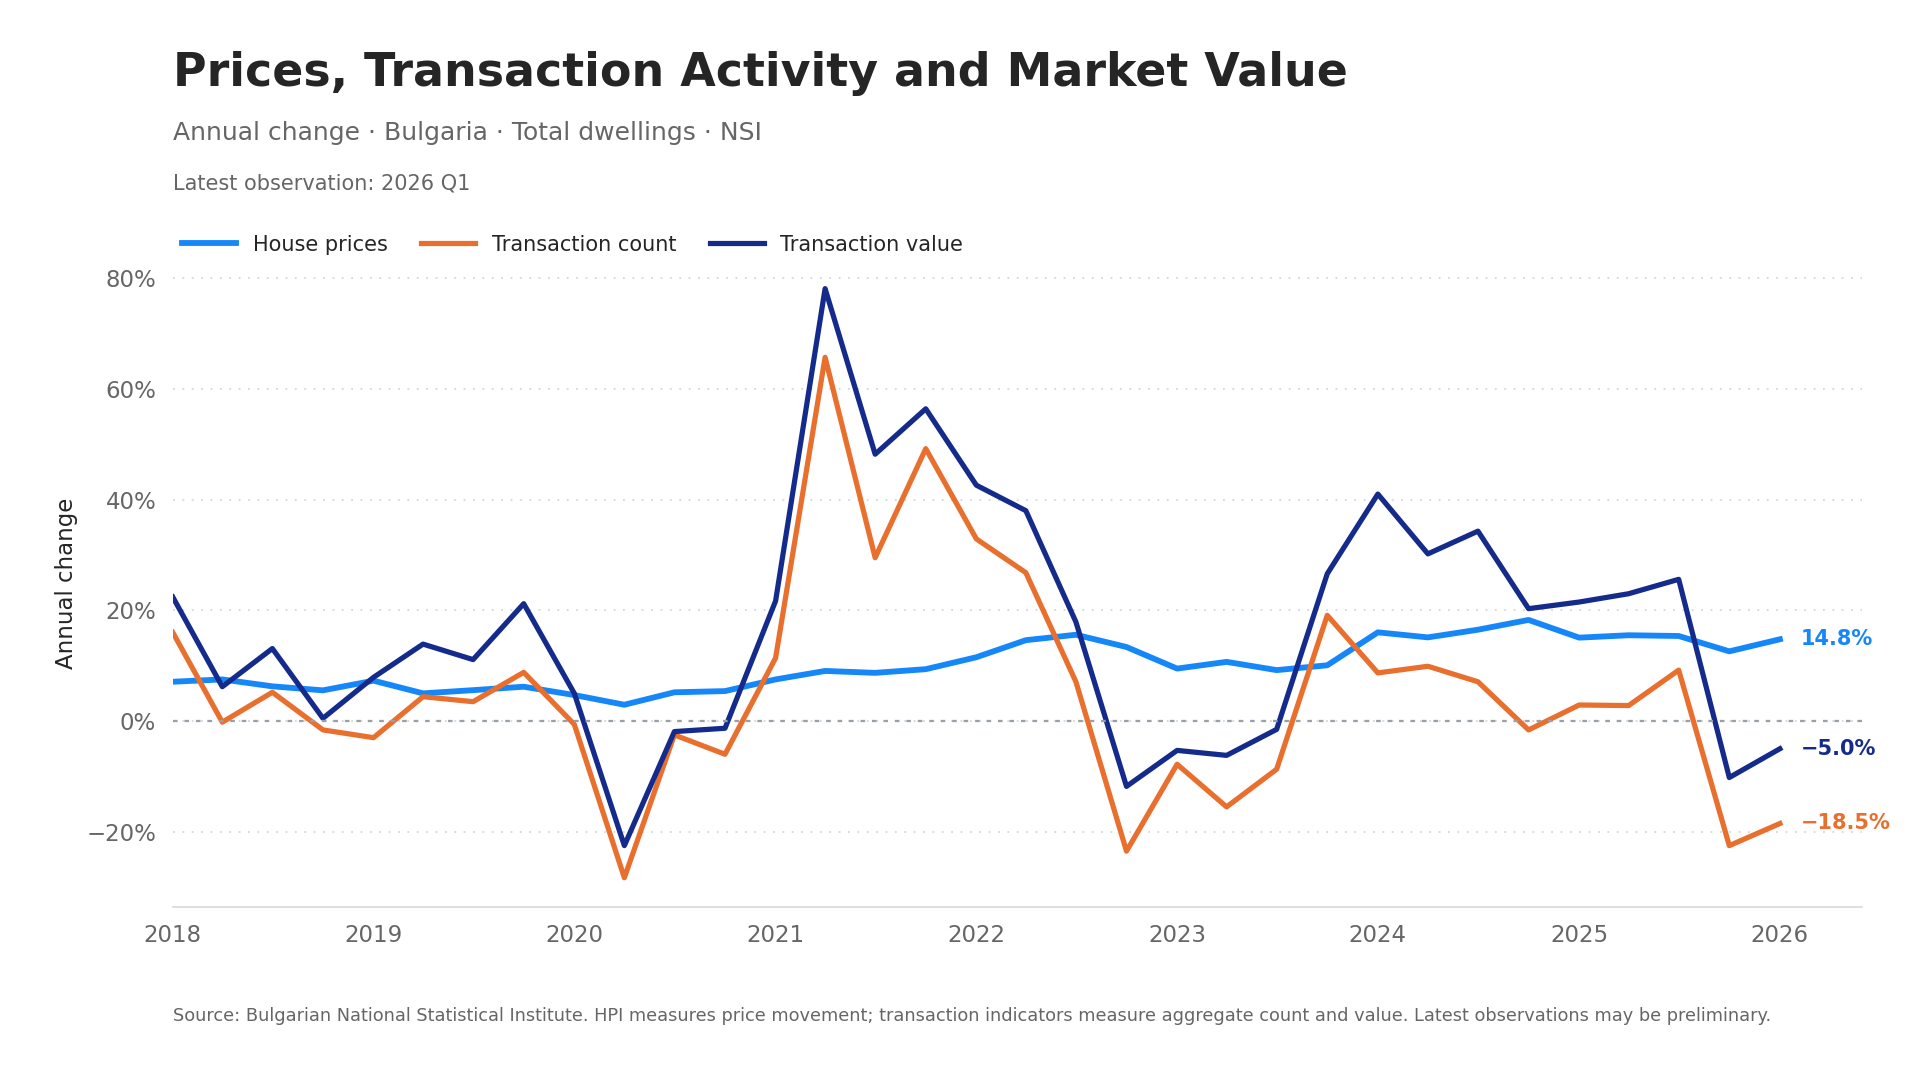
Bulgaria’s HPI increased 14.8% year on year in 2026 Q1, while the number of dwelling transactions fell 18.5%. Aggregate transaction value also declined, but by a much smaller 5.0%.
In practical terms, fewer deals are taking place while the value of completed activity is holding up better. The two transaction series imply a 16.6% increase in value per transaction. That is useful as a signal of the changing transaction mix, but it is not an observed average sale price or a price per square metre.
The city picture is less uniform
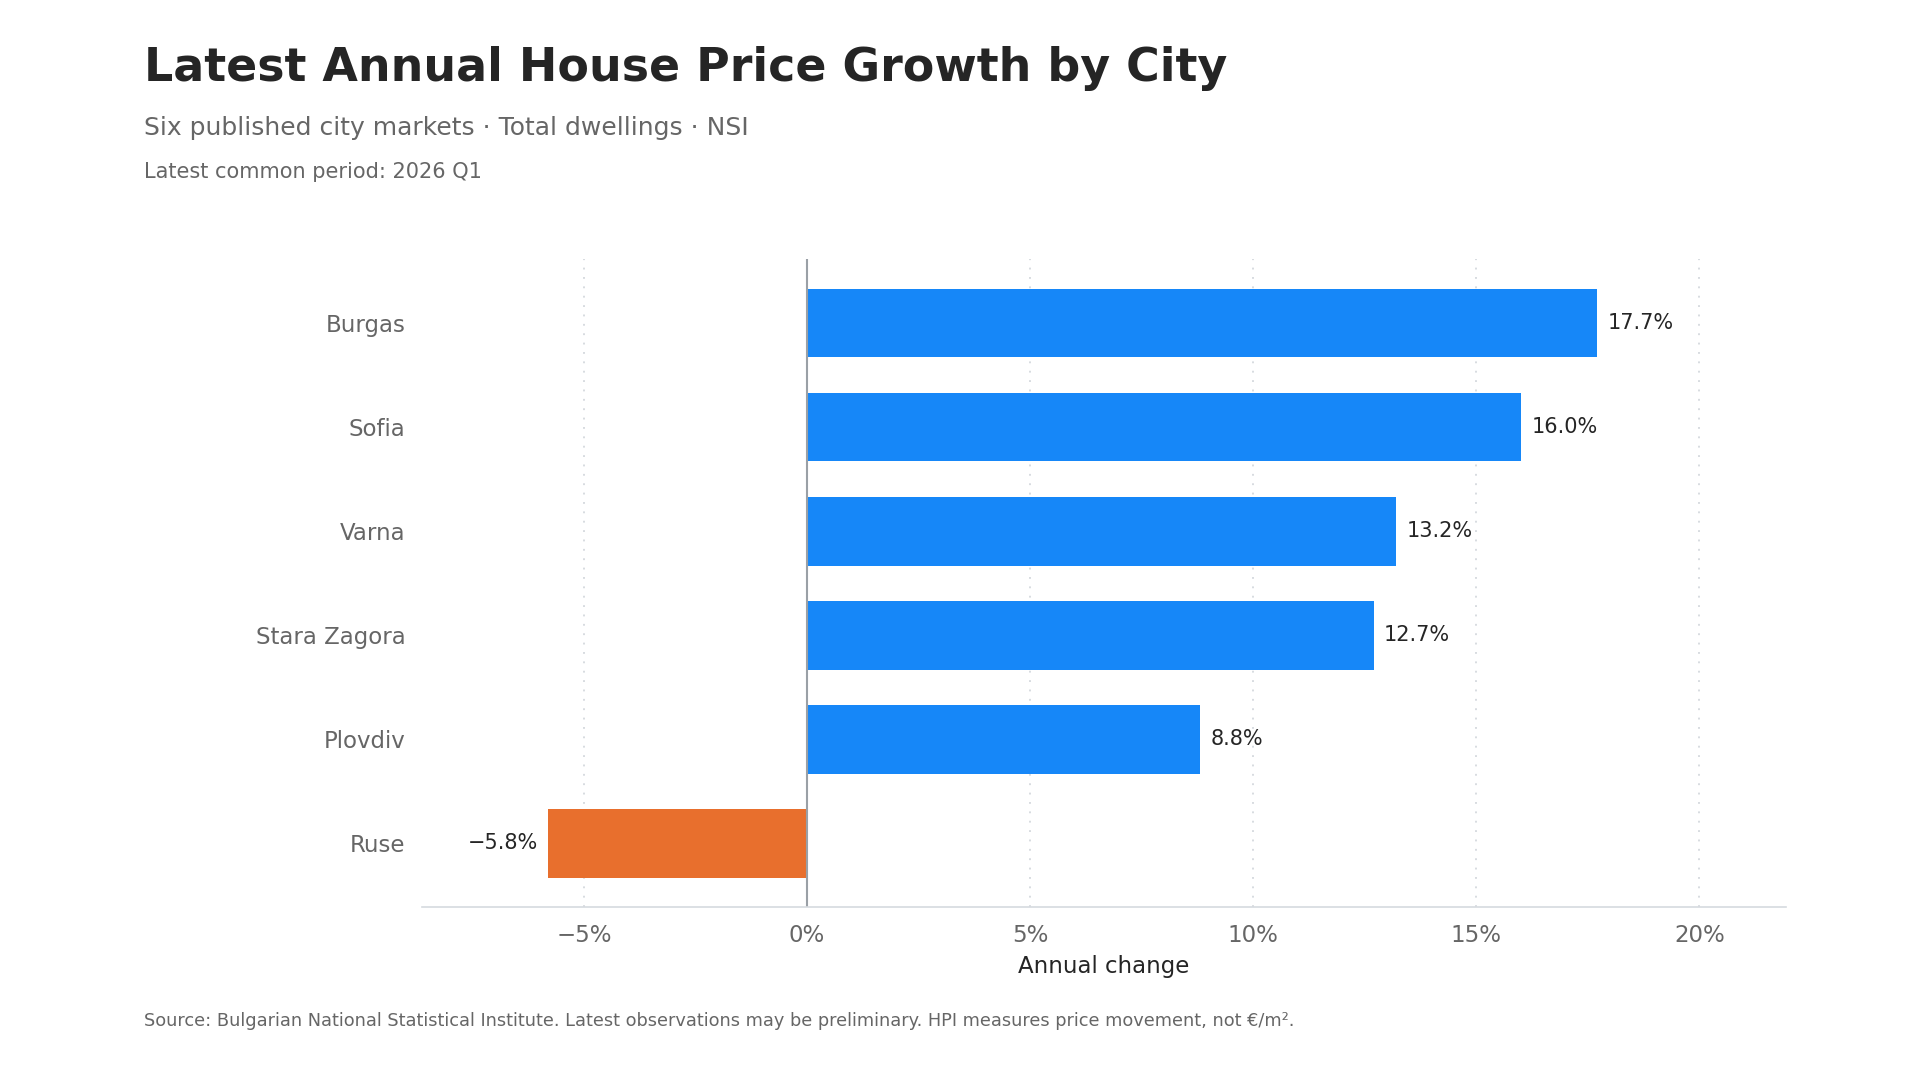
All six NUTS2 regions recorded positive annual HPI growth in 2026 Q1, but the city results were more varied. Burgas led the six published cities at 17.7%, followed by Sofia at 16.0% and Varna at 13.2%. Ruse was the exception at −5.8%.
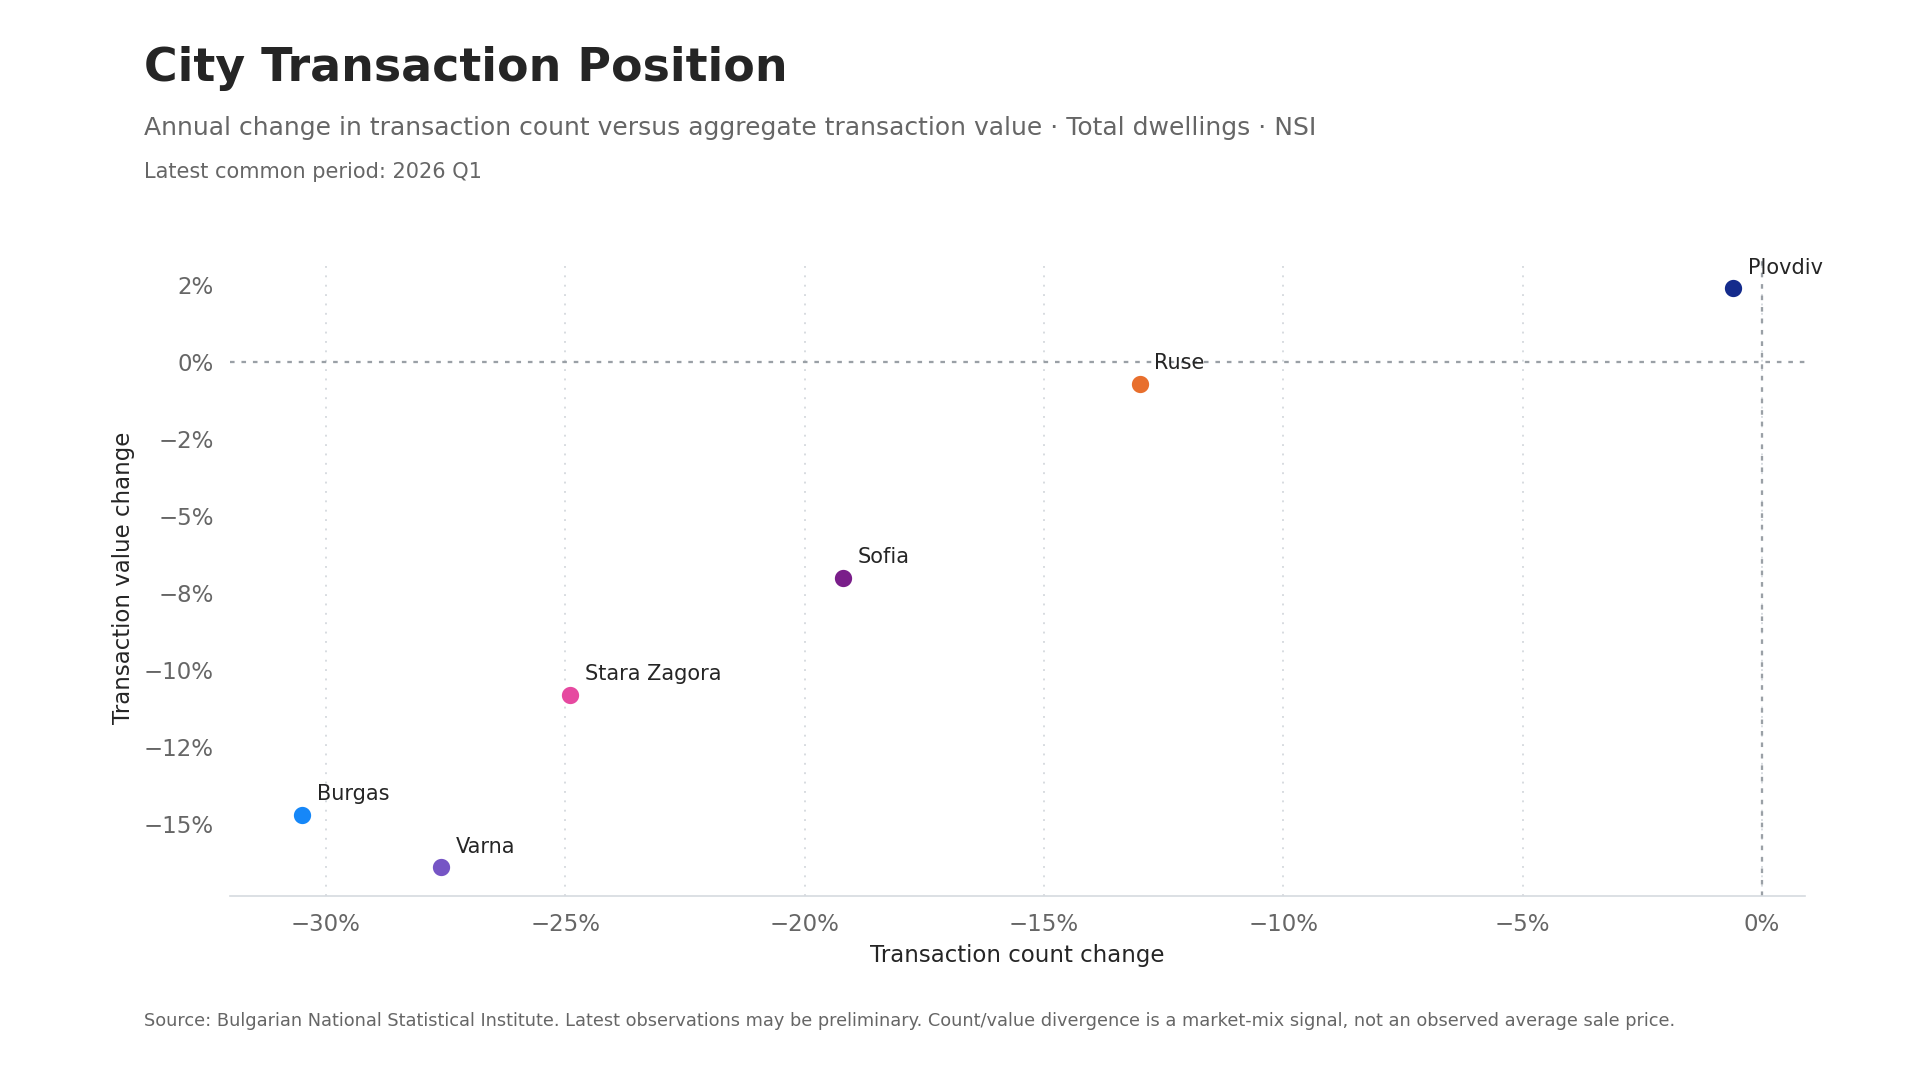
The transaction data produce a different order. Plovdiv was comparatively resilient, while Burgas and Varna recorded much sharper declines in both count and aggregate value. A city with strong recent price growth is therefore not necessarily the city with the broadest current activity.
Credit is supportive, while delivery remains costly
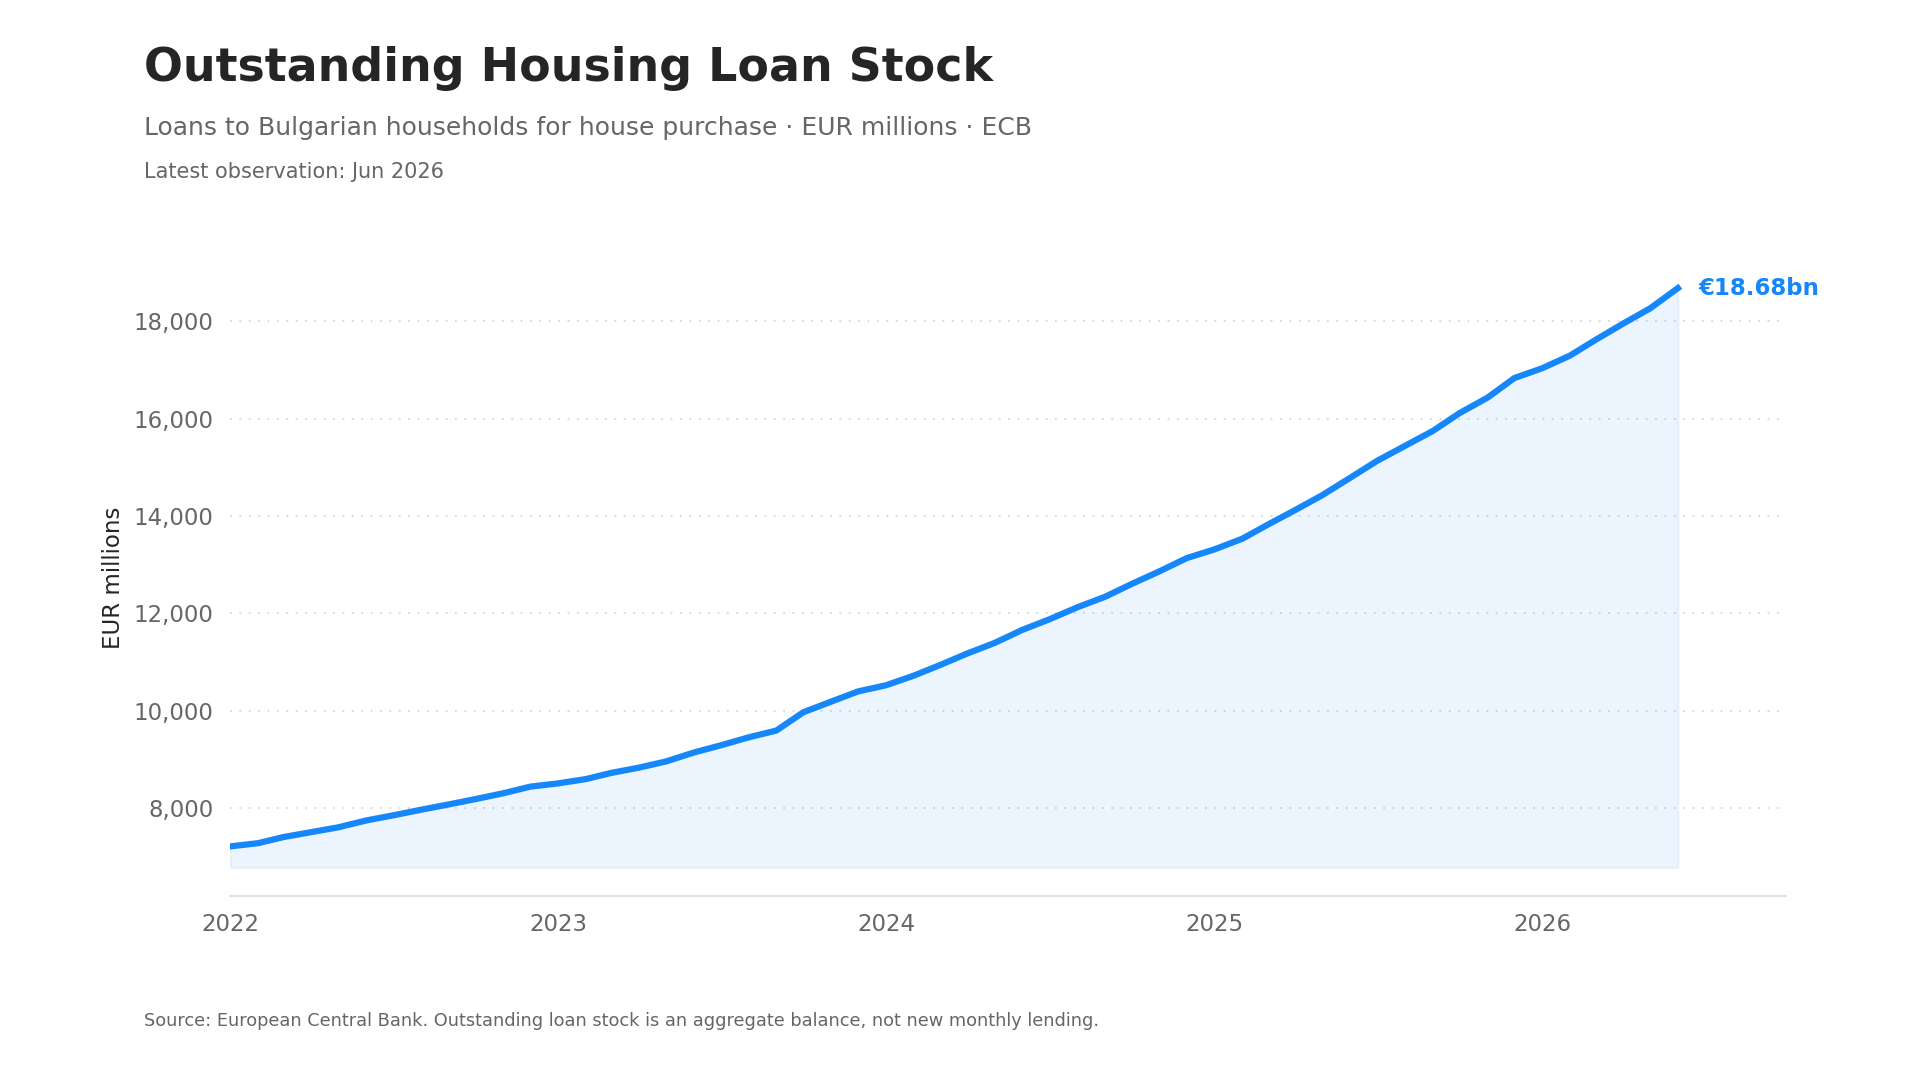
Outstanding housing-loan stock reached €18.68bn in June 2026, up 26.4% year on year, while the new-housing-loan rate stood at 2.41%. Credit remains an important support for demand, although growth at this pace also deserves close monitoring.
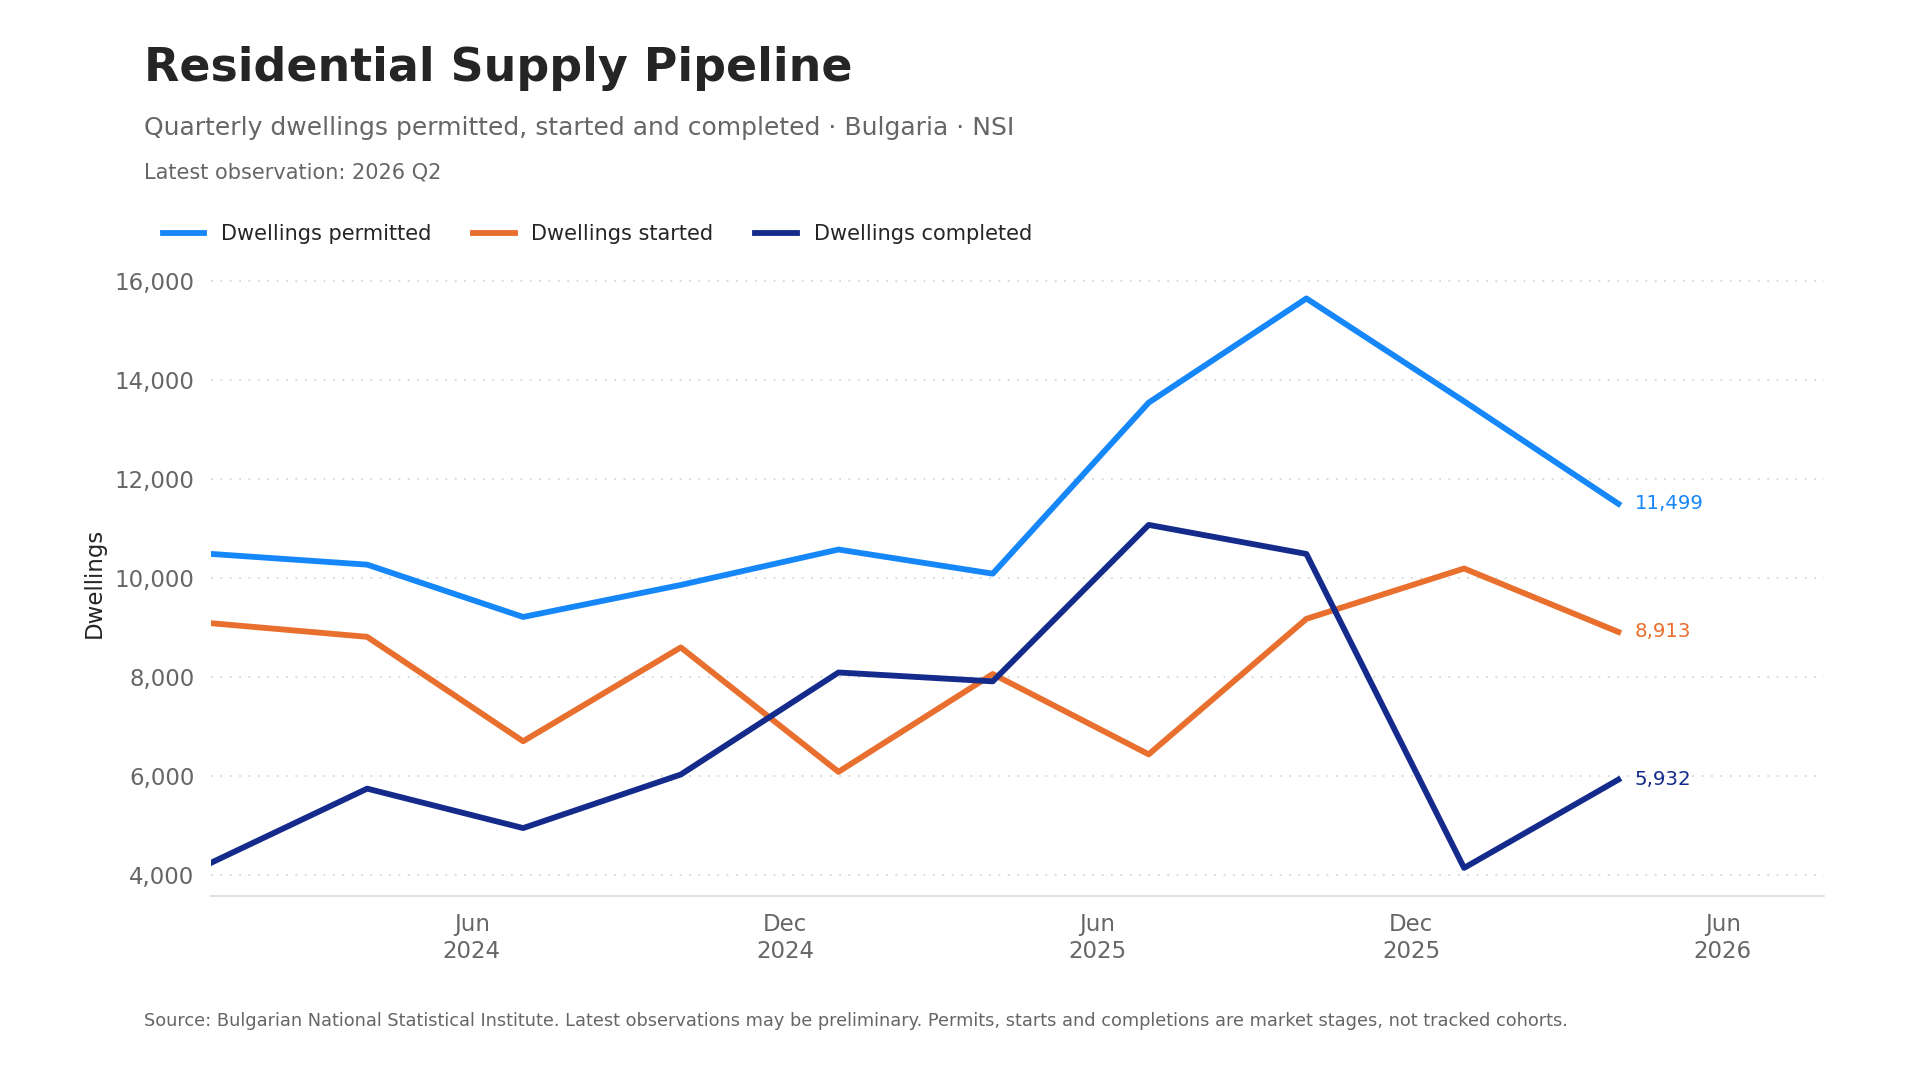
On the supply side, preliminary 2026 Q2 data recorded 11,499 dwellings permitted, 8,913 started and 5,932 completed. These are separate market stages rather than the same homes moving through a tracked funnel. Total construction costs also rose 14.0% year on year, meaning that a larger pipeline is not automatically the same as faster or cheaper delivery.
What to monitor next
- Transaction breadth: whether counts recover while HPI remains positive.
- Credit transmission: whether loan growth remains above 20%.
- Pipeline delivery: whether elevated permits are followed by starts and completions.
- Cost pressure: whether material and total cost growth ease.
- Regional balance: whether city liquidity divergence persists.
Need a more specific market screen?
A tailored official-data brief can be prepared for a selected city, region or professional research question before local due diligence begins.
Ask about a focused market brief →